Indonesian vs Immigrants from Bolivia Family Poverty
COMPARE
Indonesian
Immigrants from Bolivia
Family Poverty
Family Poverty Comparison
Indonesians
Immigrants from Bolivia
11.3%
FAMILY POVERTY
0.0/ 100
METRIC RATING
283rd/ 347
METRIC RANK
7.7%
FAMILY POVERTY
98.9/ 100
METRIC RATING
49th/ 347
METRIC RANK
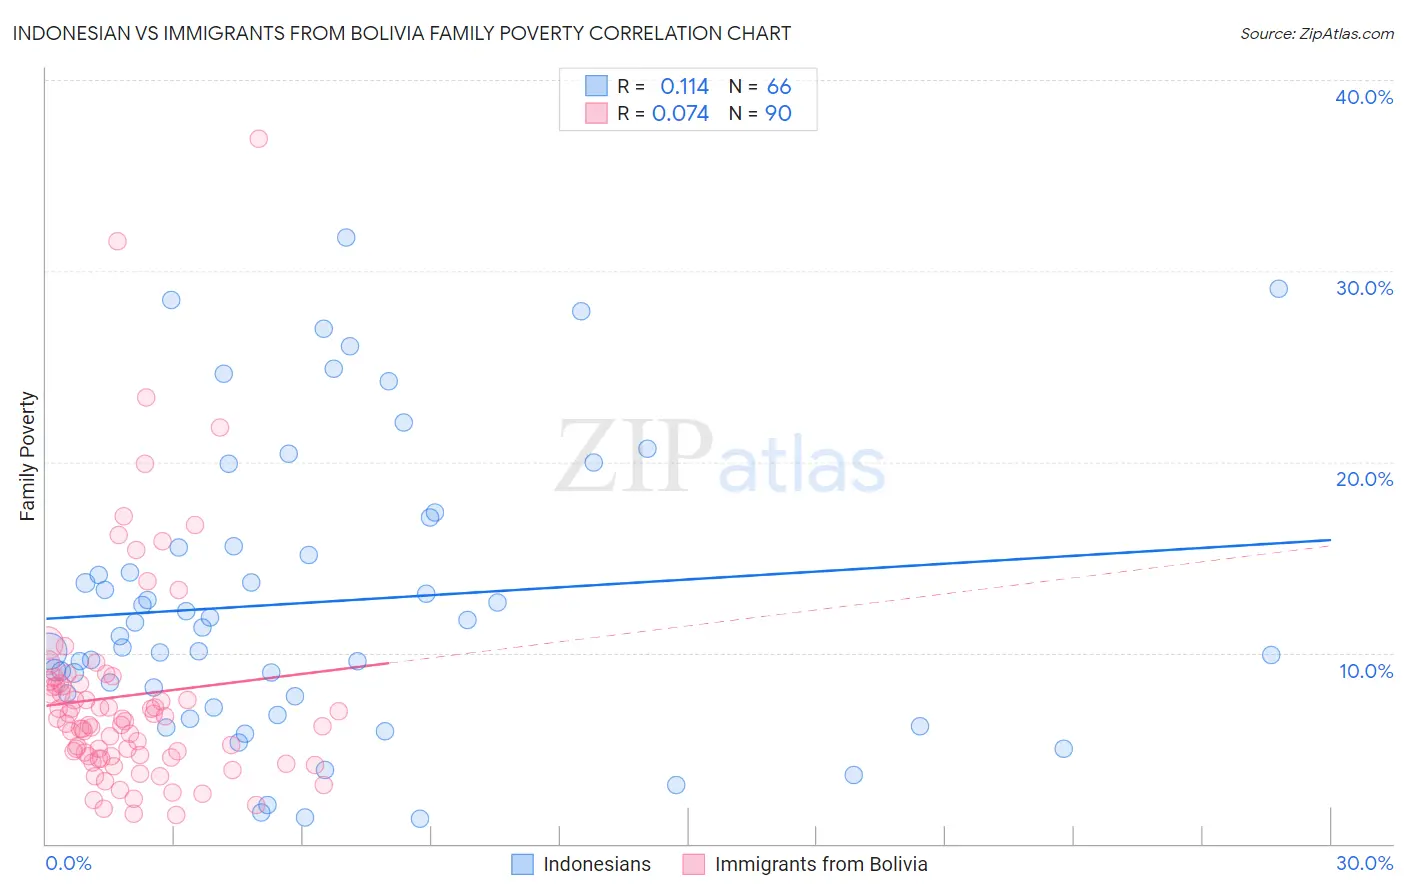
Indonesian vs Immigrants from Bolivia Family Poverty Correlation Chart
The statistical analysis conducted on geographies consisting of 162,562,549 people shows a poor positive correlation between the proportion of Indonesians and poverty level among families in the United States with a correlation coefficient (R) of 0.114 and weighted average of 11.3%. Similarly, the statistical analysis conducted on geographies consisting of 158,596,723 people shows a slight positive correlation between the proportion of Immigrants from Bolivia and poverty level among families in the United States with a correlation coefficient (R) of 0.074 and weighted average of 7.7%, a difference of 47.4%.
Family Poverty Correlation Summary
| Measurement | Indonesian | Immigrants from Bolivia |
| Minimum | 1.3% | 1.5% |
| Maximum | 31.7% | 36.9% |
| Range | 30.4% | 35.4% |
| Mean | 12.7% | 7.8% |
| Median | 11.1% | 6.4% |
| Interquartile 25% (IQ1) | 7.7% | 4.6% |
| Interquartile 75% (IQ3) | 15.6% | 8.4% |
| Interquartile Range (IQR) | 7.9% | 3.8% |
| Standard Deviation (Sample) | 7.5% | 5.9% |
| Standard Deviation (Population) | 7.5% | 5.9% |
Similar Demographics by Family Poverty
Demographics Similar to Indonesians by Family Poverty
In terms of family poverty, the demographic groups most similar to Indonesians are Immigrants from Cuba (11.3%, a difference of 0.040%), Yaqui (11.3%, a difference of 0.12%), Barbadian (11.3%, a difference of 0.20%), Immigrants from West Indies (11.3%, a difference of 0.30%), and Belizean (11.3%, a difference of 0.57%).
| Demographics | Rating | Rank | Family Poverty |
| Immigrants | Guyana | 0.1 /100 | #276 | Tragic 11.2% |
| Chippewa | 0.1 /100 | #277 | Tragic 11.2% |
| Guyanese | 0.1 /100 | #278 | Tragic 11.2% |
| Blackfeet | 0.0 /100 | #279 | Tragic 11.3% |
| Belizeans | 0.0 /100 | #280 | Tragic 11.3% |
| Immigrants | West Indies | 0.0 /100 | #281 | Tragic 11.3% |
| Immigrants | Cuba | 0.0 /100 | #282 | Tragic 11.3% |
| Indonesians | 0.0 /100 | #283 | Tragic 11.3% |
| Yaqui | 0.0 /100 | #284 | Tragic 11.3% |
| Barbadians | 0.0 /100 | #285 | Tragic 11.3% |
| Senegalese | 0.0 /100 | #286 | Tragic 11.5% |
| Vietnamese | 0.0 /100 | #287 | Tragic 11.5% |
| Immigrants | Belize | 0.0 /100 | #288 | Tragic 11.5% |
| Immigrants | Barbados | 0.0 /100 | #289 | Tragic 11.5% |
| West Indians | 0.0 /100 | #290 | Tragic 11.5% |
Demographics Similar to Immigrants from Bolivia by Family Poverty
In terms of family poverty, the demographic groups most similar to Immigrants from Bolivia are Immigrants from North Macedonia (7.7%, a difference of 0.030%), Immigrants from Moldova (7.7%, a difference of 0.18%), Immigrants from Sri Lanka (7.7%, a difference of 0.19%), Immigrants from Czechoslovakia (7.7%, a difference of 0.20%), and Tongan (7.7%, a difference of 0.22%).
| Demographics | Rating | Rank | Family Poverty |
| Scandinavians | 99.1 /100 | #42 | Exceptional 7.6% |
| Immigrants | Austria | 99.1 /100 | #43 | Exceptional 7.6% |
| Germans | 99.0 /100 | #44 | Exceptional 7.7% |
| Okinawans | 98.9 /100 | #45 | Exceptional 7.7% |
| Tongans | 98.9 /100 | #46 | Exceptional 7.7% |
| Immigrants | Czechoslovakia | 98.9 /100 | #47 | Exceptional 7.7% |
| Immigrants | Sri Lanka | 98.9 /100 | #48 | Exceptional 7.7% |
| Immigrants | Bolivia | 98.9 /100 | #49 | Exceptional 7.7% |
| Immigrants | North Macedonia | 98.9 /100 | #50 | Exceptional 7.7% |
| Immigrants | Moldova | 98.8 /100 | #51 | Exceptional 7.7% |
| Indians (Asian) | 98.8 /100 | #52 | Exceptional 7.7% |
| Swiss | 98.8 /100 | #53 | Exceptional 7.7% |
| Immigrants | Sweden | 98.8 /100 | #54 | Exceptional 7.7% |
| Immigrants | Eastern Asia | 98.7 /100 | #55 | Exceptional 7.7% |
| Immigrants | Serbia | 98.7 /100 | #56 | Exceptional 7.7% |