Inupiat vs Yaqui Female Poverty
COMPARE
Inupiat
Yaqui
Female Poverty
Female Poverty Comparison
Inupiat
Yaqui
16.2%
FEMALE POVERTY
0.0/ 100
METRIC RATING
286th/ 347
METRIC RANK
16.4%
FEMALE POVERTY
0.0/ 100
METRIC RATING
291st/ 347
METRIC RANK
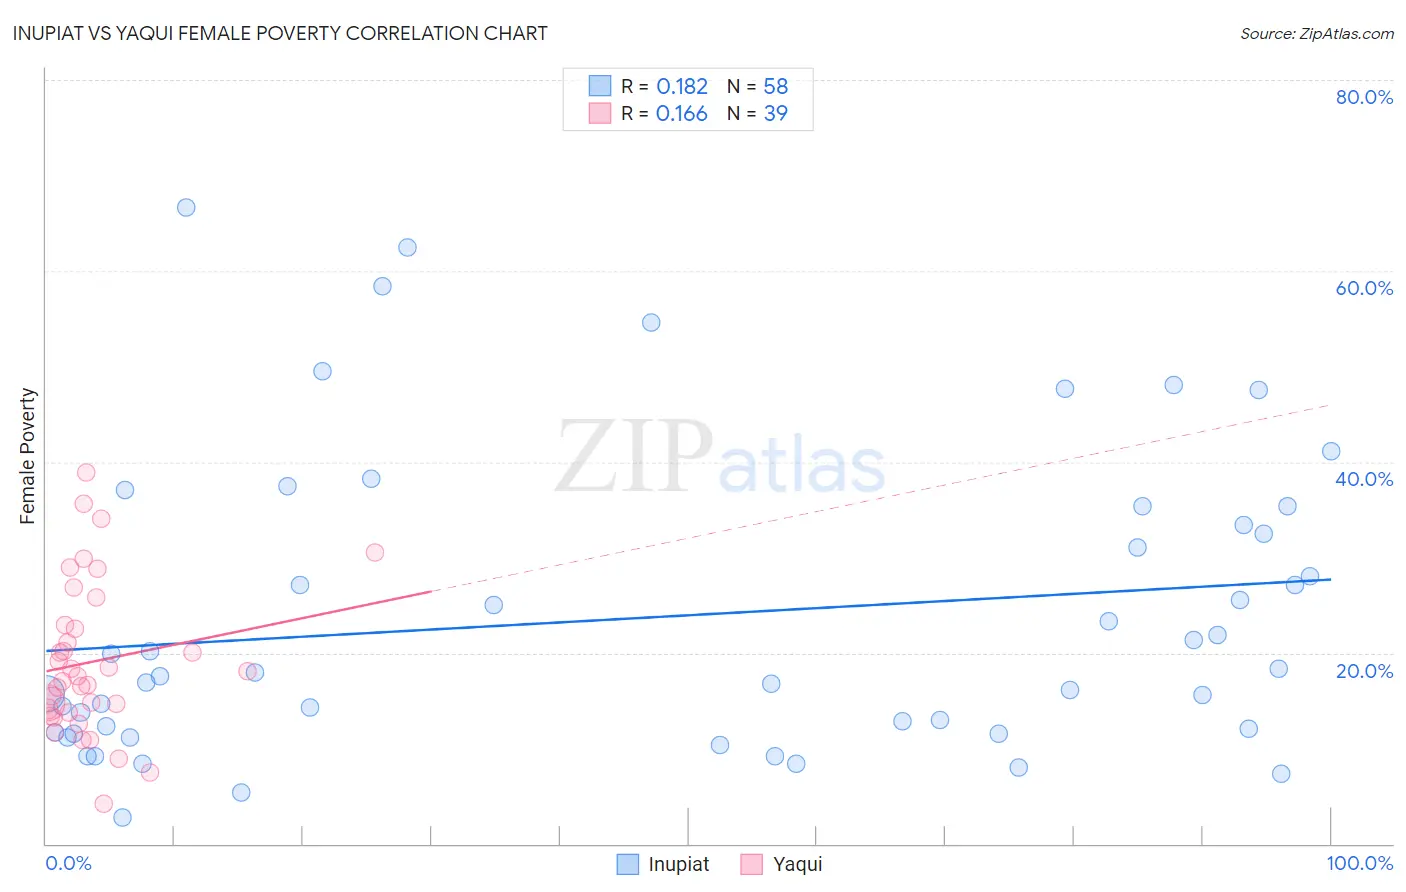
Inupiat vs Yaqui Female Poverty Correlation Chart
The statistical analysis conducted on geographies consisting of 96,314,579 people shows a poor positive correlation between the proportion of Inupiat and poverty level among females in the United States with a correlation coefficient (R) of 0.182 and weighted average of 16.2%. Similarly, the statistical analysis conducted on geographies consisting of 107,715,533 people shows a poor positive correlation between the proportion of Yaqui and poverty level among females in the United States with a correlation coefficient (R) of 0.166 and weighted average of 16.4%, a difference of 1.1%.
Female Poverty Correlation Summary
| Measurement | Inupiat | Yaqui |
| Minimum | 2.8% | 4.2% |
| Maximum | 66.7% | 38.9% |
| Range | 63.9% | 34.7% |
| Mean | 23.7% | 19.1% |
| Median | 17.7% | 17.6% |
| Interquartile 25% (IQ1) | 11.6% | 13.7% |
| Interquartile 75% (IQ3) | 33.3% | 22.9% |
| Interquartile Range (IQR) | 21.7% | 9.1% |
| Standard Deviation (Sample) | 15.6% | 7.9% |
| Standard Deviation (Population) | 15.5% | 7.8% |
Demographics Similar to Inupiat and Yaqui by Female Poverty
In terms of female poverty, the demographic groups most similar to Inupiat are Immigrants from Belize (16.3%, a difference of 0.19%), Comanche (16.2%, a difference of 0.44%), Spanish American (16.2%, a difference of 0.52%), Immigrants from Cuba (16.1%, a difference of 0.57%), and Immigrants from Haiti (16.1%, a difference of 0.65%). Similarly, the demographic groups most similar to Yaqui are Immigrants from Zaire (16.4%, a difference of 0.010%), Immigrants from Latin America (16.4%, a difference of 0.070%), Immigrants from Cabo Verde (16.4%, a difference of 0.10%), Immigrants from Bangladesh (16.4%, a difference of 0.17%), and Senegalese (16.5%, a difference of 0.18%).
| Demographics | Rating | Rank | Female Poverty |
| Immigrants | West Indies | 0.0 /100 | #278 | Tragic 16.1% |
| Immigrants | Bahamas | 0.0 /100 | #279 | Tragic 16.1% |
| Vietnamese | 0.0 /100 | #280 | Tragic 16.1% |
| West Indians | 0.0 /100 | #281 | Tragic 16.1% |
| Immigrants | Haiti | 0.0 /100 | #282 | Tragic 16.1% |
| Immigrants | Cuba | 0.0 /100 | #283 | Tragic 16.1% |
| Spanish Americans | 0.0 /100 | #284 | Tragic 16.2% |
| Comanche | 0.0 /100 | #285 | Tragic 16.2% |
| Inupiat | 0.0 /100 | #286 | Tragic 16.2% |
| Immigrants | Belize | 0.0 /100 | #287 | Tragic 16.3% |
| Indonesians | 0.0 /100 | #288 | Tragic 16.4% |
| Blackfeet | 0.0 /100 | #289 | Tragic 16.4% |
| Immigrants | Bangladesh | 0.0 /100 | #290 | Tragic 16.4% |
| Yaqui | 0.0 /100 | #291 | Tragic 16.4% |
| Immigrants | Zaire | 0.0 /100 | #292 | Tragic 16.4% |
| Immigrants | Latin America | 0.0 /100 | #293 | Tragic 16.4% |
| Immigrants | Cabo Verde | 0.0 /100 | #294 | Tragic 16.4% |
| Senegalese | 0.0 /100 | #295 | Tragic 16.5% |
| Immigrants | Senegal | 0.0 /100 | #296 | Tragic 16.5% |
| Mexicans | 0.0 /100 | #297 | Tragic 16.5% |
| Somalis | 0.0 /100 | #298 | Tragic 16.6% |