Iraqi vs Immigrants from Kenya Single Male Poverty
COMPARE
Iraqi
Immigrants from Kenya
Single Male Poverty
Single Male Poverty Comparison
Iraqis
Immigrants from Kenya
12.3%
SINGLE MALE POVERTY
95.1/ 100
METRIC RATING
107th/ 347
METRIC RANK
12.5%
SINGLE MALE POVERTY
87.6/ 100
METRIC RATING
123rd/ 347
METRIC RANK
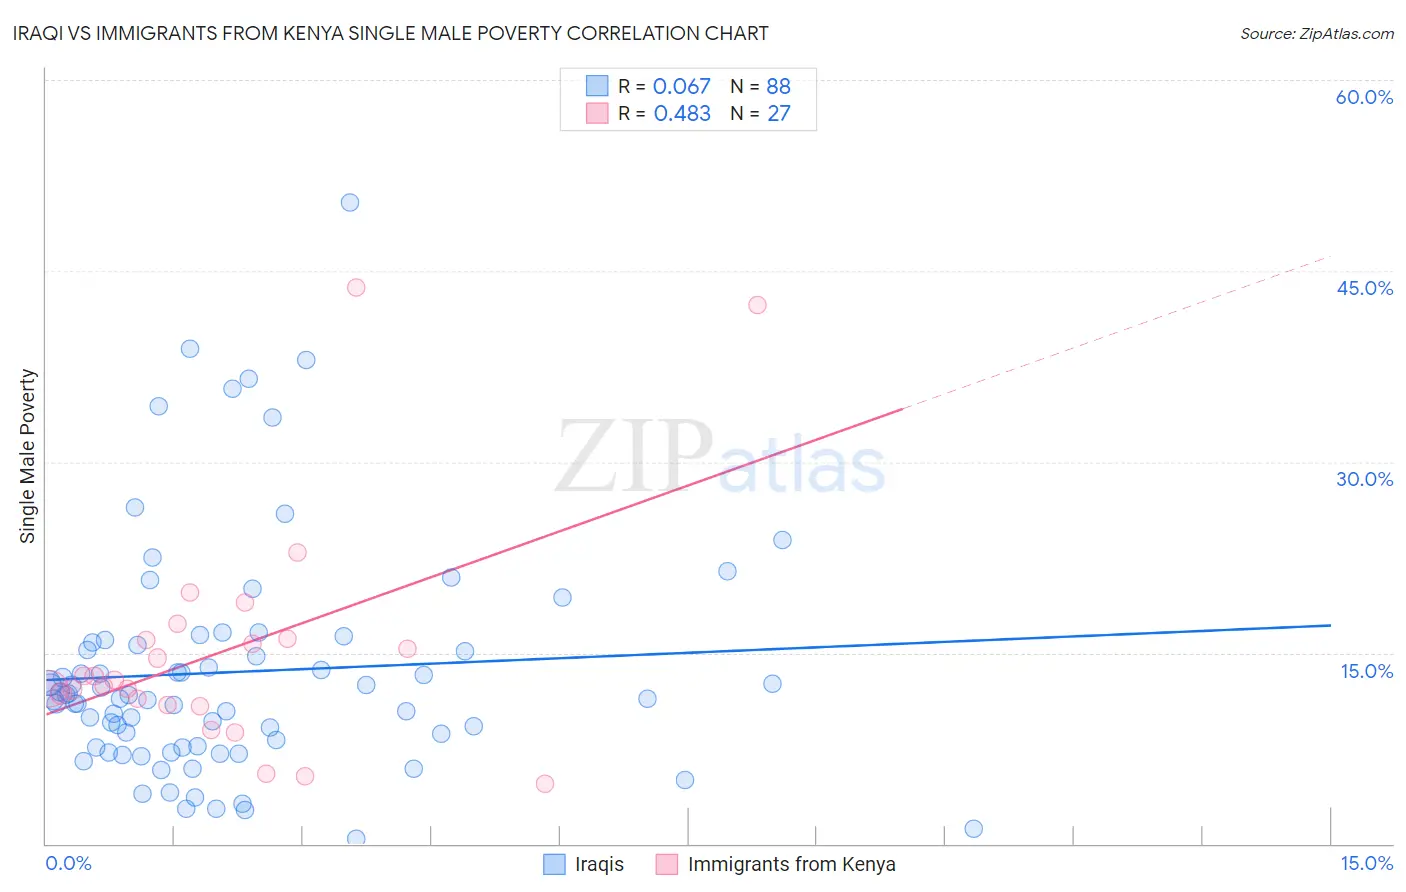
Iraqi vs Immigrants from Kenya Single Male Poverty Correlation Chart
The statistical analysis conducted on geographies consisting of 160,224,189 people shows a slight positive correlation between the proportion of Iraqis and poverty level among single males in the United States with a correlation coefficient (R) of 0.067 and weighted average of 12.3%. Similarly, the statistical analysis conducted on geographies consisting of 201,857,660 people shows a moderate positive correlation between the proportion of Immigrants from Kenya and poverty level among single males in the United States with a correlation coefficient (R) of 0.483 and weighted average of 12.5%, a difference of 1.4%.
Single Male Poverty Correlation Summary
| Measurement | Iraqi | Immigrants from Kenya |
| Minimum | 0.42% | 4.8% |
| Maximum | 50.4% | 43.7% |
| Range | 50.0% | 38.9% |
| Mean | 13.5% | 15.1% |
| Median | 11.5% | 12.9% |
| Interquartile 25% (IQ1) | 7.6% | 10.9% |
| Interquartile 75% (IQ3) | 15.7% | 16.1% |
| Interquartile Range (IQR) | 8.1% | 5.2% |
| Standard Deviation (Sample) | 9.1% | 9.1% |
| Standard Deviation (Population) | 9.1% | 8.9% |
Demographics Similar to Iraqis and Immigrants from Kenya by Single Male Poverty
In terms of single male poverty, the demographic groups most similar to Iraqis are Immigrants from Eastern Africa (12.3%, a difference of 0.020%), Ugandan (12.3%, a difference of 0.15%), Immigrants from Morocco (12.3%, a difference of 0.18%), Jordanian (12.3%, a difference of 0.26%), and Immigrants from Portugal (12.3%, a difference of 0.38%). Similarly, the demographic groups most similar to Immigrants from Kenya are Russian (12.5%, a difference of 0.030%), Serbian (12.5%, a difference of 0.040%), Immigrants from Jordan (12.5%, a difference of 0.060%), Icelander (12.5%, a difference of 0.090%), and Venezuelan (12.4%, a difference of 0.24%).
| Demographics | Rating | Rank | Single Male Poverty |
| Jordanians | 95.9 /100 | #105 | Exceptional 12.3% |
| Immigrants | Morocco | 95.6 /100 | #106 | Exceptional 12.3% |
| Iraqis | 95.1 /100 | #107 | Exceptional 12.3% |
| Immigrants | Eastern Africa | 95.0 /100 | #108 | Exceptional 12.3% |
| Ugandans | 94.5 /100 | #109 | Exceptional 12.3% |
| Immigrants | Portugal | 93.6 /100 | #110 | Exceptional 12.3% |
| Immigrants | North Macedonia | 93.6 /100 | #111 | Exceptional 12.3% |
| Kenyans | 93.3 /100 | #112 | Exceptional 12.4% |
| Pakistanis | 92.4 /100 | #113 | Exceptional 12.4% |
| Nicaraguans | 92.1 /100 | #114 | Exceptional 12.4% |
| Immigrants | Southern Europe | 91.5 /100 | #115 | Exceptional 12.4% |
| Immigrants | Syria | 91.2 /100 | #116 | Exceptional 12.4% |
| Immigrants | Oceania | 91.1 /100 | #117 | Exceptional 12.4% |
| Albanians | 90.6 /100 | #118 | Exceptional 12.4% |
| Immigrants | Albania | 90.3 /100 | #119 | Exceptional 12.4% |
| Venezuelans | 89.4 /100 | #120 | Excellent 12.4% |
| Icelanders | 88.2 /100 | #121 | Excellent 12.5% |
| Serbians | 87.9 /100 | #122 | Excellent 12.5% |
| Immigrants | Kenya | 87.6 /100 | #123 | Excellent 12.5% |
| Russians | 87.3 /100 | #124 | Excellent 12.5% |
| Immigrants | Jordan | 87.1 /100 | #125 | Excellent 12.5% |