Irish vs Central American Single Mother Poverty
COMPARE
Irish
Central American
Single Mother Poverty
Single Mother Poverty Comparison
Irish
Central Americans
29.8%
SINGLE MOTHER POVERTY
13.9/ 100
METRIC RATING
209th/ 347
METRIC RANK
31.8%
SINGLE MOTHER POVERTY
0.1/ 100
METRIC RATING
275th/ 347
METRIC RANK
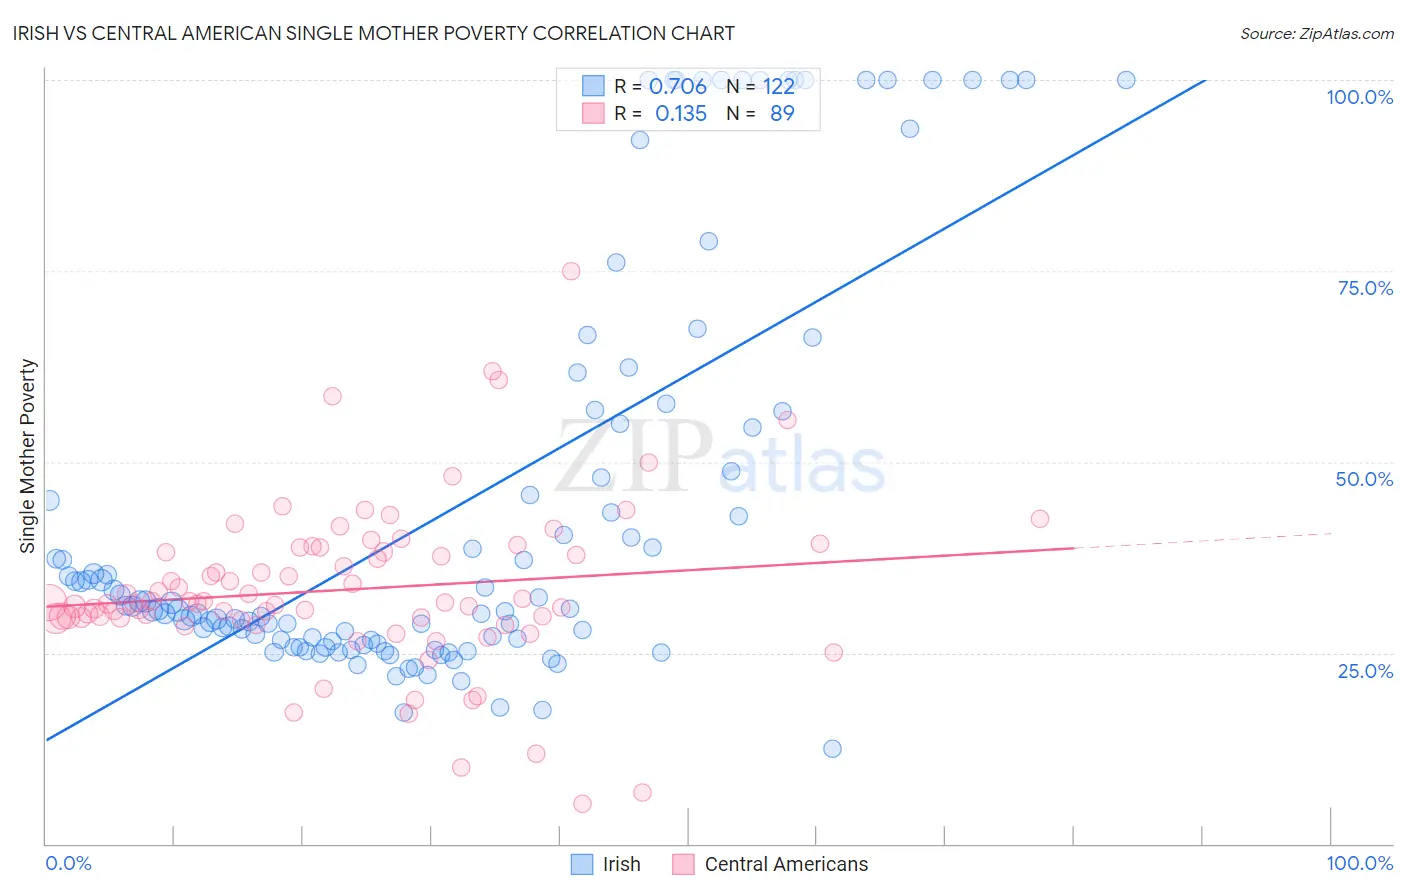
Irish vs Central American Single Mother Poverty Correlation Chart
The statistical analysis conducted on geographies consisting of 549,467,184 people shows a strong positive correlation between the proportion of Irish and poverty level among single mothers in the United States with a correlation coefficient (R) of 0.706 and weighted average of 29.8%. Similarly, the statistical analysis conducted on geographies consisting of 489,410,238 people shows a poor positive correlation between the proportion of Central Americans and poverty level among single mothers in the United States with a correlation coefficient (R) of 0.135 and weighted average of 31.8%, a difference of 6.7%.
Single Mother Poverty Correlation Summary
| Measurement | Irish | Central American |
| Minimum | 12.4% | 5.3% |
| Maximum | 100.0% | 75.0% |
| Range | 87.6% | 69.8% |
| Mean | 43.8% | 33.3% |
| Median | 30.8% | 31.5% |
| Interquartile 25% (IQ1) | 26.6% | 29.5% |
| Interquartile 75% (IQ3) | 54.5% | 38.5% |
| Interquartile Range (IQR) | 28.0% | 8.9% |
| Standard Deviation (Sample) | 26.6% | 10.9% |
| Standard Deviation (Population) | 26.5% | 10.9% |
Similar Demographics by Single Mother Poverty
Demographics Similar to Irish by Single Mother Poverty
In terms of single mother poverty, the demographic groups most similar to Irish are Haitian (29.8%, a difference of 0.060%), Immigrants from Guyana (29.8%, a difference of 0.080%), Guyanese (29.8%, a difference of 0.11%), Immigrants from Panama (29.8%, a difference of 0.15%), and Nicaraguan (29.8%, a difference of 0.15%).
| Demographics | Rating | Rank | Single Mother Poverty |
| Malaysians | 17.4 /100 | #202 | Poor 29.7% |
| Swiss | 17.2 /100 | #203 | Poor 29.7% |
| Immigrants | Immigrants | 16.6 /100 | #204 | Poor 29.7% |
| Czechoslovakians | 16.1 /100 | #205 | Poor 29.7% |
| Immigrants | Haiti | 15.8 /100 | #206 | Poor 29.7% |
| Immigrants | Panama | 15.5 /100 | #207 | Poor 29.8% |
| Immigrants | Guyana | 14.7 /100 | #208 | Poor 29.8% |
| Irish | 13.9 /100 | #209 | Poor 29.8% |
| Haitians | 13.3 /100 | #210 | Poor 29.8% |
| Guyanese | 12.8 /100 | #211 | Poor 29.8% |
| Nicaraguans | 12.4 /100 | #212 | Poor 29.8% |
| Immigrants | Thailand | 12.0 /100 | #213 | Poor 29.9% |
| Liberians | 11.7 /100 | #214 | Poor 29.9% |
| Jamaicans | 11.7 /100 | #215 | Poor 29.9% |
| Immigrants | Western Africa | 11.5 /100 | #216 | Poor 29.9% |
Demographics Similar to Central Americans by Single Mother Poverty
In terms of single mother poverty, the demographic groups most similar to Central Americans are Delaware (31.8%, a difference of 0.16%), Bangladeshi (31.7%, a difference of 0.19%), Mexican American Indian (31.9%, a difference of 0.37%), Fijian (31.6%, a difference of 0.42%), and Immigrants from Zaire (32.0%, a difference of 0.60%).
| Demographics | Rating | Rank | Single Mother Poverty |
| Immigrants | Senegal | 0.1 /100 | #268 | Tragic 31.5% |
| Scotch-Irish | 0.1 /100 | #269 | Tragic 31.5% |
| British West Indians | 0.1 /100 | #270 | Tragic 31.5% |
| Immigrants | Cabo Verde | 0.1 /100 | #271 | Tragic 31.6% |
| Immigrants | Micronesia | 0.1 /100 | #272 | Tragic 31.6% |
| Fijians | 0.1 /100 | #273 | Tragic 31.6% |
| Bangladeshis | 0.1 /100 | #274 | Tragic 31.7% |
| Central Americans | 0.1 /100 | #275 | Tragic 31.8% |
| Delaware | 0.0 /100 | #276 | Tragic 31.8% |
| Mexican American Indians | 0.0 /100 | #277 | Tragic 31.9% |
| Immigrants | Zaire | 0.0 /100 | #278 | Tragic 32.0% |
| Marshallese | 0.0 /100 | #279 | Tragic 32.1% |
| Immigrants | Nonimmigrants | 0.0 /100 | #280 | Tragic 32.2% |
| Cree | 0.0 /100 | #281 | Tragic 32.2% |
| Immigrants | Azores | 0.0 /100 | #282 | Tragic 32.2% |