Irish vs Immigrants from Egypt Poverty
COMPARE
Irish
Immigrants from Egypt
Poverty
Poverty Comparison
Irish
Immigrants from Egypt
11.3%
POVERTY
96.6/ 100
METRIC RATING
81st/ 347
METRIC RANK
11.5%
POVERTY
94.6/ 100
METRIC RATING
97th/ 347
METRIC RANK
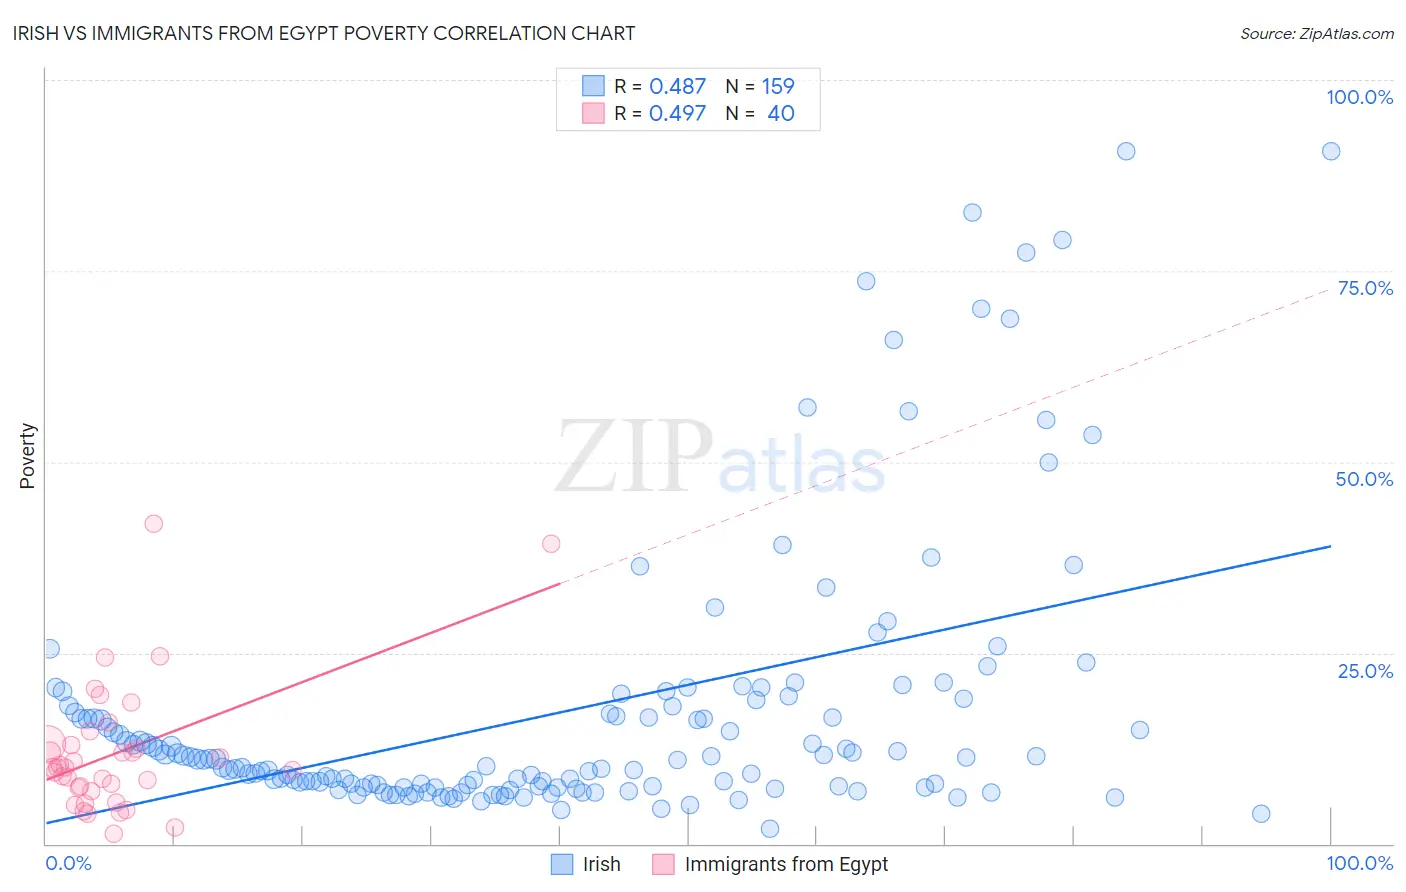
Irish vs Immigrants from Egypt Poverty Correlation Chart
The statistical analysis conducted on geographies consisting of 579,456,030 people shows a moderate positive correlation between the proportion of Irish and poverty level in the United States with a correlation coefficient (R) of 0.487 and weighted average of 11.3%. Similarly, the statistical analysis conducted on geographies consisting of 245,409,377 people shows a moderate positive correlation between the proportion of Immigrants from Egypt and poverty level in the United States with a correlation coefficient (R) of 0.497 and weighted average of 11.5%, a difference of 1.3%.
Poverty Correlation Summary
| Measurement | Irish | Immigrants from Egypt |
| Minimum | 2.0% | 1.3% |
| Maximum | 90.7% | 41.8% |
| Range | 88.7% | 40.5% |
| Mean | 17.4% | 11.9% |
| Median | 11.0% | 9.9% |
| Interquartile 25% (IQ1) | 7.5% | 7.1% |
| Interquartile 75% (IQ3) | 18.1% | 13.0% |
| Interquartile Range (IQR) | 10.6% | 5.9% |
| Standard Deviation (Sample) | 18.1% | 8.6% |
| Standard Deviation (Population) | 18.0% | 8.5% |
Demographics Similar to Irish and Immigrants from Egypt by Poverty
In terms of poverty, the demographic groups most similar to Irish are Indian (Asian) (11.3%, a difference of 0.0%), Cambodian (11.3%, a difference of 0.020%), Egyptian (11.3%, a difference of 0.090%), Immigrants from Sweden (11.3%, a difference of 0.27%), and English (11.3%, a difference of 0.28%). Similarly, the demographic groups most similar to Immigrants from Egypt are Immigrants from South Africa (11.5%, a difference of 0.030%), Immigrants from Latvia (11.5%, a difference of 0.030%), Australian (11.4%, a difference of 0.15%), Paraguayan (11.4%, a difference of 0.16%), and Immigrants from Indonesia (11.5%, a difference of 0.17%).
| Demographics | Rating | Rank | Poverty |
| Cambodians | 96.7 /100 | #79 | Exceptional 11.3% |
| Indians (Asian) | 96.6 /100 | #80 | Exceptional 11.3% |
| Irish | 96.6 /100 | #81 | Exceptional 11.3% |
| Egyptians | 96.5 /100 | #82 | Exceptional 11.3% |
| Immigrants | Sweden | 96.3 /100 | #83 | Exceptional 11.3% |
| English | 96.3 /100 | #84 | Exceptional 11.3% |
| Immigrants | England | 96.2 /100 | #85 | Exceptional 11.4% |
| Jordanians | 96.0 /100 | #86 | Exceptional 11.4% |
| Northern Europeans | 96.0 /100 | #87 | Exceptional 11.4% |
| Belgians | 95.8 /100 | #88 | Exceptional 11.4% |
| Czechoslovakians | 95.7 /100 | #89 | Exceptional 11.4% |
| Immigrants | Denmark | 95.5 /100 | #90 | Exceptional 11.4% |
| Finns | 95.2 /100 | #91 | Exceptional 11.4% |
| British | 95.0 /100 | #92 | Exceptional 11.4% |
| Romanians | 94.9 /100 | #93 | Exceptional 11.4% |
| Paraguayans | 94.9 /100 | #94 | Exceptional 11.4% |
| Australians | 94.9 /100 | #95 | Exceptional 11.4% |
| Immigrants | South Africa | 94.7 /100 | #96 | Exceptional 11.5% |
| Immigrants | Egypt | 94.6 /100 | #97 | Exceptional 11.5% |
| Immigrants | Latvia | 94.5 /100 | #98 | Exceptional 11.5% |
| Immigrants | Indonesia | 94.2 /100 | #99 | Exceptional 11.5% |