Japanese vs Immigrants from France Single Mother Poverty
COMPARE
Japanese
Immigrants from France
Single Mother Poverty
Single Mother Poverty Comparison
Japanese
Immigrants from France
28.9%
SINGLE MOTHER POVERTY
68.0/ 100
METRIC RATING
160th/ 347
METRIC RANK
27.8%
SINGLE MOTHER POVERTY
98.2/ 100
METRIC RATING
90th/ 347
METRIC RANK
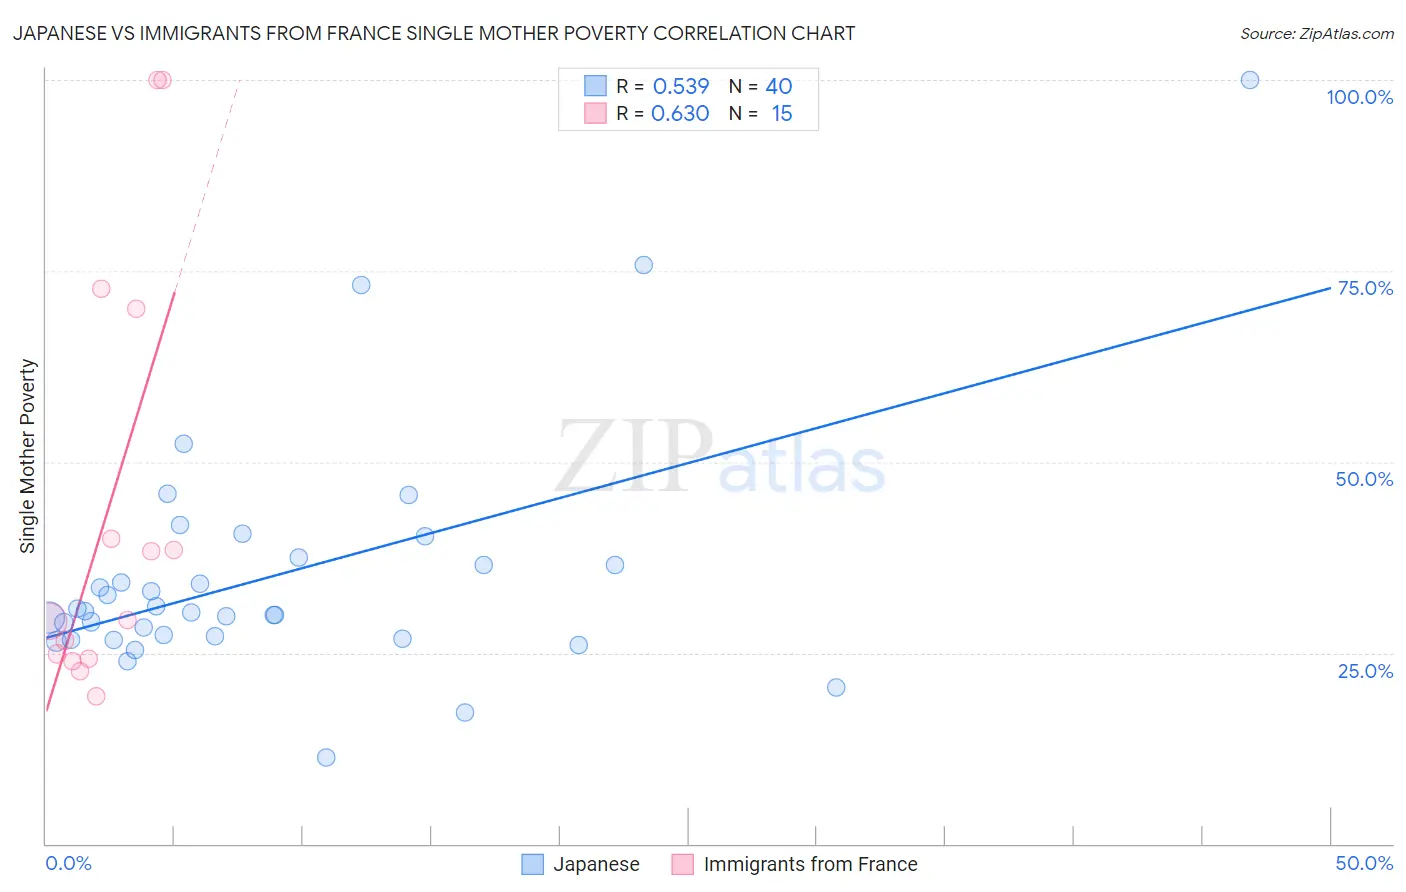
Japanese vs Immigrants from France Single Mother Poverty Correlation Chart
The statistical analysis conducted on geographies consisting of 246,409,359 people shows a substantial positive correlation between the proportion of Japanese and poverty level among single mothers in the United States with a correlation coefficient (R) of 0.539 and weighted average of 28.9%. Similarly, the statistical analysis conducted on geographies consisting of 281,639,013 people shows a significant positive correlation between the proportion of Immigrants from France and poverty level among single mothers in the United States with a correlation coefficient (R) of 0.630 and weighted average of 27.8%, a difference of 4.1%.
Single Mother Poverty Correlation Summary
| Measurement | Japanese | Immigrants from France |
| Minimum | 11.3% | 19.4% |
| Maximum | 100.0% | 100.0% |
| Range | 88.7% | 80.6% |
| Mean | 35.2% | 44.0% |
| Median | 30.4% | 29.3% |
| Interquartile 25% (IQ1) | 27.0% | 24.3% |
| Interquartile 75% (IQ3) | 37.0% | 70.0% |
| Interquartile Range (IQR) | 10.0% | 45.7% |
| Standard Deviation (Sample) | 16.1% | 27.8% |
| Standard Deviation (Population) | 15.9% | 26.9% |
Similar Demographics by Single Mother Poverty
Demographics Similar to Japanese by Single Mother Poverty
In terms of single mother poverty, the demographic groups most similar to Japanese are Czech (28.9%, a difference of 0.020%), Immigrants from Cambodia (28.9%, a difference of 0.080%), Scandinavian (28.9%, a difference of 0.10%), Immigrants from Nigeria (28.9%, a difference of 0.11%), and Immigrants from Kenya (28.9%, a difference of 0.11%).
| Demographics | Rating | Rank | Single Mother Poverty |
| Slovenes | 76.4 /100 | #153 | Good 28.8% |
| Portuguese | 73.2 /100 | #154 | Good 28.8% |
| Ugandans | 71.7 /100 | #155 | Good 28.8% |
| Iraqis | 71.5 /100 | #156 | Good 28.8% |
| Immigrants | Western Europe | 71.1 /100 | #157 | Good 28.9% |
| Immigrants | Hungary | 70.6 /100 | #158 | Good 28.9% |
| Czechs | 68.4 /100 | #159 | Good 28.9% |
| Japanese | 68.0 /100 | #160 | Good 28.9% |
| Immigrants | Cambodia | 66.6 /100 | #161 | Good 28.9% |
| Scandinavians | 66.2 /100 | #162 | Good 28.9% |
| Immigrants | Nigeria | 65.9 /100 | #163 | Good 28.9% |
| Immigrants | Kenya | 65.9 /100 | #164 | Good 28.9% |
| Arabs | 60.7 /100 | #165 | Good 29.0% |
| Inupiat | 60.4 /100 | #166 | Good 29.0% |
| Costa Ricans | 58.4 /100 | #167 | Average 29.0% |
Demographics Similar to Immigrants from France by Single Mother Poverty
In terms of single mother poverty, the demographic groups most similar to Immigrants from France are Immigrants from Albania (27.8%, a difference of 0.14%), Estonian (27.8%, a difference of 0.17%), Immigrants from Ethiopia (27.7%, a difference of 0.18%), Ethiopian (27.7%, a difference of 0.19%), and Afghan (27.7%, a difference of 0.21%).
| Demographics | Rating | Rank | Single Mother Poverty |
| Greeks | 98.7 /100 | #83 | Exceptional 27.7% |
| Immigrants | Latvia | 98.7 /100 | #84 | Exceptional 27.7% |
| Mongolians | 98.7 /100 | #85 | Exceptional 27.7% |
| Immigrants | Ukraine | 98.6 /100 | #86 | Exceptional 27.7% |
| Afghans | 98.5 /100 | #87 | Exceptional 27.7% |
| Ethiopians | 98.4 /100 | #88 | Exceptional 27.7% |
| Immigrants | Ethiopia | 98.4 /100 | #89 | Exceptional 27.7% |
| Immigrants | France | 98.2 /100 | #90 | Exceptional 27.8% |
| Immigrants | Albania | 98.0 /100 | #91 | Exceptional 27.8% |
| Estonians | 97.9 /100 | #92 | Exceptional 27.8% |
| Romanians | 97.8 /100 | #93 | Exceptional 27.8% |
| Albanians | 97.6 /100 | #94 | Exceptional 27.9% |
| Chileans | 97.5 /100 | #95 | Exceptional 27.9% |
| Immigrants | Iraq | 97.3 /100 | #96 | Exceptional 27.9% |
| Immigrants | Brazil | 97.2 /100 | #97 | Exceptional 27.9% |