Moroccan vs Immigrants from Switzerland Child Poverty Under the Age of 16
COMPARE
Moroccan
Immigrants from Switzerland
Child Poverty Under the Age of 16
Child Poverty Under the Age of 16 Comparison
Moroccans
Immigrants from Switzerland
17.6%
CHILD POVERTY UNDER THE AGE OF 16
5.3/ 100
METRIC RATING
218th/ 347
METRIC RANK
14.8%
CHILD POVERTY UNDER THE AGE OF 16
95.1/ 100
METRIC RATING
101st/ 347
METRIC RANK
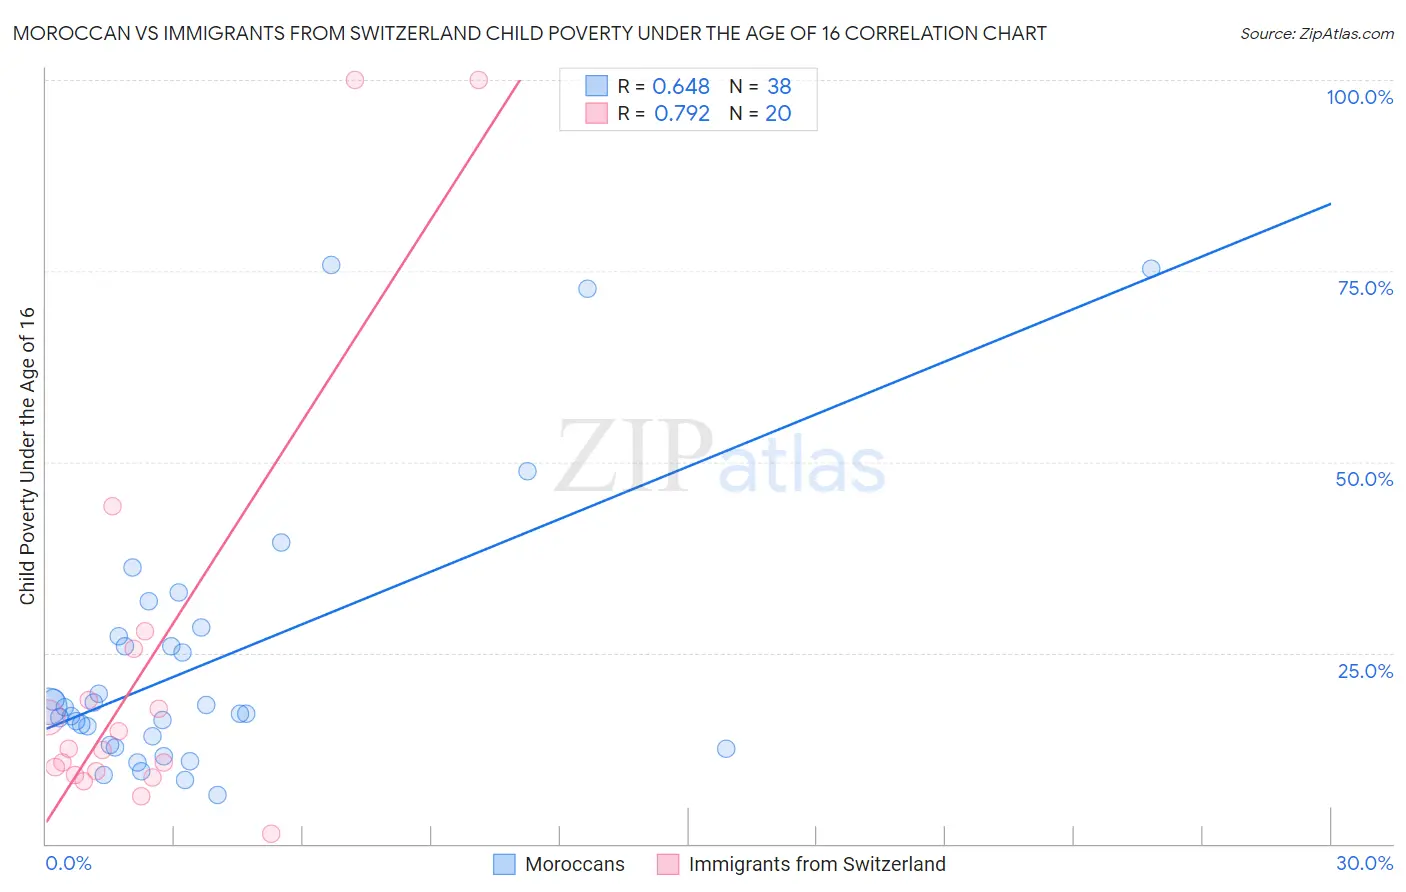
Moroccan vs Immigrants from Switzerland Child Poverty Under the Age of 16 Correlation Chart
The statistical analysis conducted on geographies consisting of 201,029,687 people shows a significant positive correlation between the proportion of Moroccans and poverty level among children under the age of 16 in the United States with a correlation coefficient (R) of 0.648 and weighted average of 17.6%. Similarly, the statistical analysis conducted on geographies consisting of 147,239,417 people shows a strong positive correlation between the proportion of Immigrants from Switzerland and poverty level among children under the age of 16 in the United States with a correlation coefficient (R) of 0.792 and weighted average of 14.8%, a difference of 19.2%.
Child Poverty Under the Age of 16 Correlation Summary
| Measurement | Moroccan | Immigrants from Switzerland |
| Minimum | 6.5% | 1.3% |
| Maximum | 75.7% | 100.0% |
| Range | 69.2% | 98.7% |
| Mean | 23.8% | 23.2% |
| Median | 17.4% | 12.4% |
| Interquartile 25% (IQ1) | 13.0% | 9.3% |
| Interquartile 75% (IQ3) | 27.2% | 22.1% |
| Interquartile Range (IQR) | 14.2% | 12.9% |
| Standard Deviation (Sample) | 17.6% | 27.9% |
| Standard Deviation (Population) | 17.4% | 27.2% |
Similar Demographics by Child Poverty Under the Age of 16
Demographics Similar to Moroccans by Child Poverty Under the Age of 16
In terms of child poverty under the age of 16, the demographic groups most similar to Moroccans are Immigrants from Eastern Africa (17.6%, a difference of 0.010%), Sierra Leonean (17.6%, a difference of 0.19%), Malaysian (17.5%, a difference of 0.31%), Iraqi (17.5%, a difference of 0.33%), and Japanese (17.7%, a difference of 0.36%).
| Demographics | Rating | Rank | Child Poverty Under the Age of 16 |
| Immigrants | Thailand | 6.6 /100 | #211 | Tragic 17.5% |
| Immigrants | Immigrants | 6.5 /100 | #212 | Tragic 17.5% |
| Immigrants | Azores | 6.2 /100 | #213 | Tragic 17.5% |
| Iraqis | 5.9 /100 | #214 | Tragic 17.5% |
| Malaysians | 5.9 /100 | #215 | Tragic 17.5% |
| Sierra Leoneans | 5.7 /100 | #216 | Tragic 17.6% |
| Immigrants | Eastern Africa | 5.3 /100 | #217 | Tragic 17.6% |
| Moroccans | 5.3 /100 | #218 | Tragic 17.6% |
| Japanese | 4.7 /100 | #219 | Tragic 17.7% |
| Immigrants | Panama | 4.1 /100 | #220 | Tragic 17.7% |
| Cubans | 3.7 /100 | #221 | Tragic 17.8% |
| Immigrants | Armenia | 3.6 /100 | #222 | Tragic 17.8% |
| Immigrants | Cambodia | 3.3 /100 | #223 | Tragic 17.8% |
| Osage | 3.1 /100 | #224 | Tragic 17.9% |
| Immigrants | Nonimmigrants | 2.7 /100 | #225 | Tragic 17.9% |
Demographics Similar to Immigrants from Switzerland by Child Poverty Under the Age of 16
In terms of child poverty under the age of 16, the demographic groups most similar to Immigrants from Switzerland are Dutch (14.8%, a difference of 0.010%), Romanian (14.8%, a difference of 0.070%), Immigrants from Egypt (14.8%, a difference of 0.11%), Immigrants from England (14.8%, a difference of 0.16%), and Basque (14.8%, a difference of 0.27%).
| Demographics | Rating | Rank | Child Poverty Under the Age of 16 |
| Immigrants | South Africa | 96.3 /100 | #94 | Exceptional 14.6% |
| Immigrants | Croatia | 96.1 /100 | #95 | Exceptional 14.6% |
| Immigrants | France | 95.8 /100 | #96 | Exceptional 14.7% |
| Paraguayans | 95.7 /100 | #97 | Exceptional 14.7% |
| Immigrants | Belarus | 95.7 /100 | #98 | Exceptional 14.7% |
| British | 95.5 /100 | #99 | Exceptional 14.7% |
| Dutch | 95.1 /100 | #100 | Exceptional 14.8% |
| Immigrants | Switzerland | 95.1 /100 | #101 | Exceptional 14.8% |
| Romanians | 95.0 /100 | #102 | Exceptional 14.8% |
| Immigrants | Egypt | 94.9 /100 | #103 | Exceptional 14.8% |
| Immigrants | England | 94.8 /100 | #104 | Exceptional 14.8% |
| Basques | 94.7 /100 | #105 | Exceptional 14.8% |
| Serbians | 94.5 /100 | #106 | Exceptional 14.8% |
| Chileans | 94.4 /100 | #107 | Exceptional 14.8% |
| Jordanians | 94.2 /100 | #108 | Exceptional 14.8% |