Native/Alaskan vs Yaqui Child Poverty Among Girls Under 16
COMPARE
Native/Alaskan
Yaqui
Child Poverty Among Girls Under 16
Child Poverty Among Girls Under 16 Comparison
Natives/Alaskans
Yaqui
24.0%
CHILD POVERTY AMONG GIRLS UNDER 16
0.0/ 100
METRIC RATING
332nd/ 347
METRIC RANK
20.3%
CHILD POVERTY AMONG GIRLS UNDER 16
0.0/ 100
METRIC RATING
284th/ 347
METRIC RANK
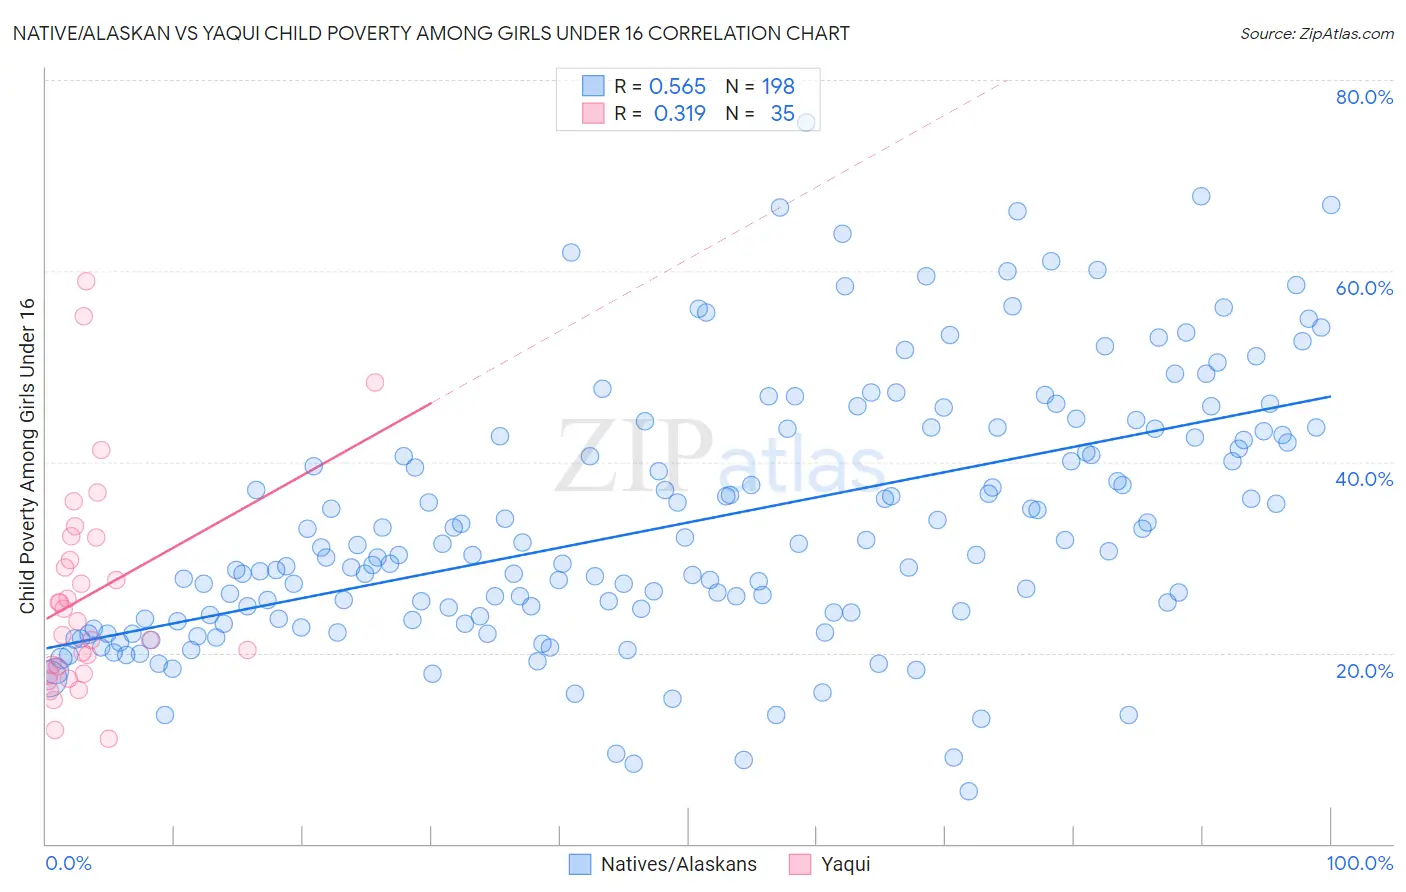
Native/Alaskan vs Yaqui Child Poverty Among Girls Under 16 Correlation Chart
The statistical analysis conducted on geographies consisting of 501,562,202 people shows a substantial positive correlation between the proportion of Natives/Alaskans and poverty level among girls under the age of 16 in the United States with a correlation coefficient (R) of 0.565 and weighted average of 24.0%. Similarly, the statistical analysis conducted on geographies consisting of 107,293,356 people shows a mild positive correlation between the proportion of Yaqui and poverty level among girls under the age of 16 in the United States with a correlation coefficient (R) of 0.319 and weighted average of 20.3%, a difference of 18.3%.
Child Poverty Among Girls Under 16 Correlation Summary
| Measurement | Native/Alaskan | Yaqui |
| Minimum | 5.5% | 11.0% |
| Maximum | 75.5% | 58.9% |
| Range | 70.0% | 47.9% |
| Mean | 33.7% | 26.1% |
| Median | 30.5% | 23.3% |
| Interquartile 25% (IQ1) | 23.6% | 18.0% |
| Interquartile 75% (IQ3) | 42.8% | 32.1% |
| Interquartile Range (IQR) | 19.2% | 14.2% |
| Standard Deviation (Sample) | 13.6% | 11.3% |
| Standard Deviation (Population) | 13.5% | 11.2% |
Similar Demographics by Child Poverty Among Girls Under 16
Demographics Similar to Natives/Alaskans by Child Poverty Among Girls Under 16
In terms of child poverty among girls under 16, the demographic groups most similar to Natives/Alaskans are Apache (23.8%, a difference of 0.86%), Immigrants from Dominican Republic (23.8%, a difference of 0.91%), Kiowa (23.7%, a difference of 1.5%), Dominican (23.7%, a difference of 1.6%), and Black/African American (24.7%, a difference of 2.5%).
| Demographics | Rating | Rank | Child Poverty Among Girls Under 16 |
| Immigrants | Congo | 0.0 /100 | #325 | Tragic 22.7% |
| Immigrants | Honduras | 0.0 /100 | #326 | Tragic 22.8% |
| Central American Indians | 0.0 /100 | #327 | Tragic 22.8% |
| Dominicans | 0.0 /100 | #328 | Tragic 23.7% |
| Kiowa | 0.0 /100 | #329 | Tragic 23.7% |
| Immigrants | Dominican Republic | 0.0 /100 | #330 | Tragic 23.8% |
| Apache | 0.0 /100 | #331 | Tragic 23.8% |
| Natives/Alaskans | 0.0 /100 | #332 | Tragic 24.0% |
| Blacks/African Americans | 0.0 /100 | #333 | Tragic 24.7% |
| Menominee | 0.0 /100 | #334 | Tragic 25.0% |
| Pueblo | 0.0 /100 | #335 | Tragic 25.2% |
| Sioux | 0.0 /100 | #336 | Tragic 25.6% |
| Yup'ik | 0.0 /100 | #337 | Tragic 25.8% |
| Cheyenne | 0.0 /100 | #338 | Tragic 26.3% |
| Crow | 0.0 /100 | #339 | Tragic 26.4% |
Demographics Similar to Yaqui by Child Poverty Among Girls Under 16
In terms of child poverty among girls under 16, the demographic groups most similar to Yaqui are Senegalese (20.3%, a difference of 0.030%), West Indian (20.3%, a difference of 0.080%), Immigrants from Cabo Verde (20.3%, a difference of 0.14%), Central American (20.2%, a difference of 0.36%), and Immigrants from Liberia (20.2%, a difference of 0.43%).
| Demographics | Rating | Rank | Child Poverty Among Girls Under 16 |
| Belizeans | 0.0 /100 | #277 | Tragic 20.2% |
| Barbadians | 0.0 /100 | #278 | Tragic 20.2% |
| Immigrants | Zaire | 0.0 /100 | #279 | Tragic 20.2% |
| Immigrants | Liberia | 0.0 /100 | #280 | Tragic 20.2% |
| Central Americans | 0.0 /100 | #281 | Tragic 20.2% |
| West Indians | 0.0 /100 | #282 | Tragic 20.3% |
| Senegalese | 0.0 /100 | #283 | Tragic 20.3% |
| Yaqui | 0.0 /100 | #284 | Tragic 20.3% |
| Immigrants | Cabo Verde | 0.0 /100 | #285 | Tragic 20.3% |
| Iroquois | 0.0 /100 | #286 | Tragic 20.4% |
| Blackfeet | 0.0 /100 | #287 | Tragic 20.5% |
| Haitians | 0.0 /100 | #288 | Tragic 20.5% |
| Immigrants | Belize | 0.0 /100 | #289 | Tragic 20.6% |
| Immigrants | Haiti | 0.0 /100 | #290 | Tragic 20.6% |
| Chippewa | 0.0 /100 | #291 | Tragic 20.6% |