Nigerian vs Immigrants from Burma/Myanmar Female Poverty
COMPARE
Nigerian
Immigrants from Burma/Myanmar
Female Poverty
Female Poverty Comparison
Nigerians
Immigrants from Burma/Myanmar
14.8%
FEMALE POVERTY
1.7/ 100
METRIC RATING
231st/ 347
METRIC RANK
15.4%
FEMALE POVERTY
0.3/ 100
METRIC RATING
252nd/ 347
METRIC RANK
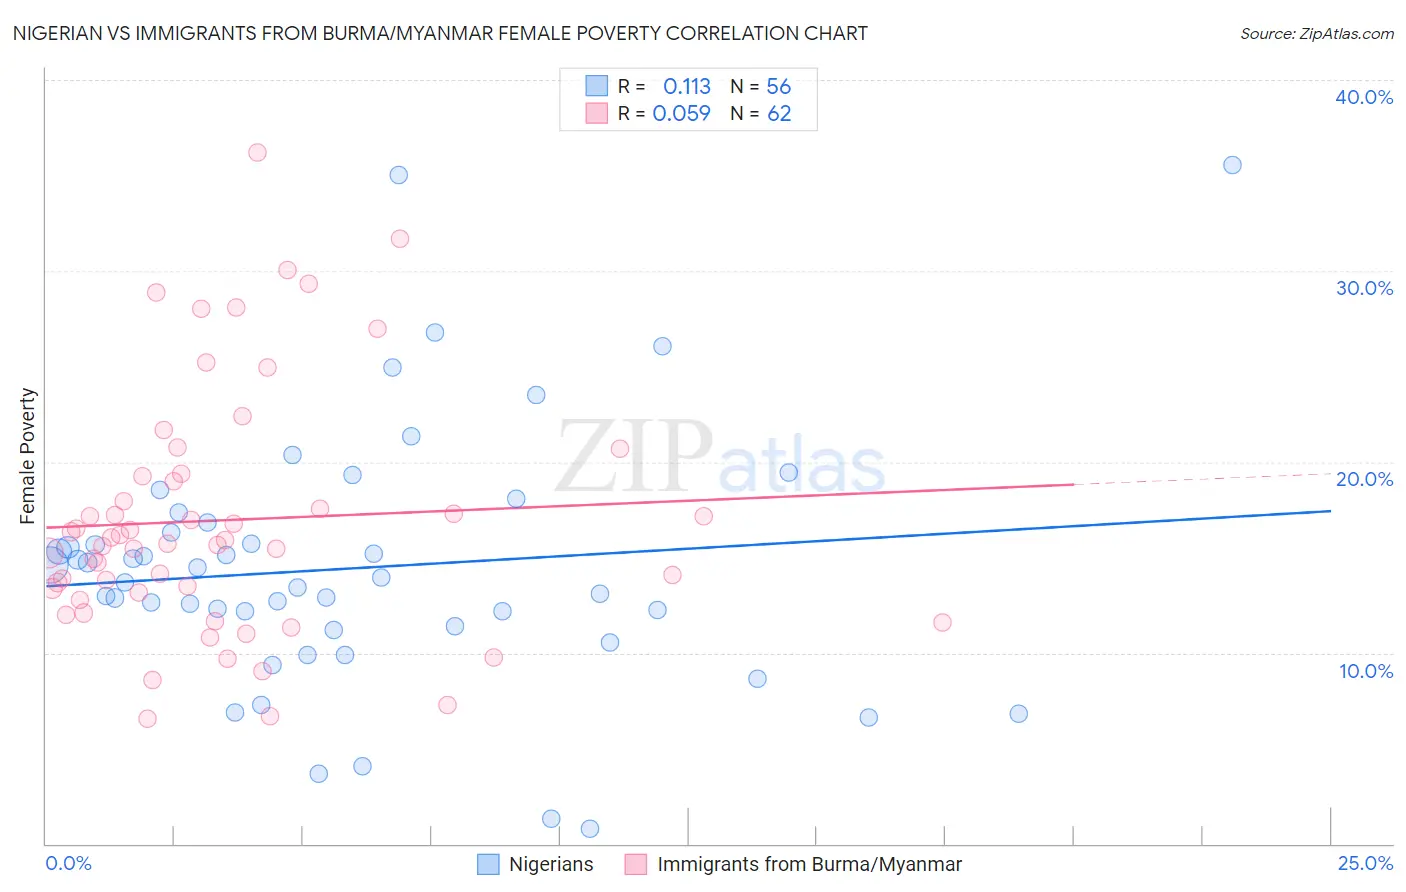
Nigerian vs Immigrants from Burma/Myanmar Female Poverty Correlation Chart
The statistical analysis conducted on geographies consisting of 332,444,319 people shows a poor positive correlation between the proportion of Nigerians and poverty level among females in the United States with a correlation coefficient (R) of 0.113 and weighted average of 14.8%. Similarly, the statistical analysis conducted on geographies consisting of 172,266,194 people shows a slight positive correlation between the proportion of Immigrants from Burma/Myanmar and poverty level among females in the United States with a correlation coefficient (R) of 0.059 and weighted average of 15.4%, a difference of 4.1%.
Female Poverty Correlation Summary
| Measurement | Nigerian | Immigrants from Burma/Myanmar |
| Minimum | 0.81% | 6.5% |
| Maximum | 35.6% | 36.2% |
| Range | 34.7% | 29.7% |
| Mean | 14.4% | 17.0% |
| Median | 13.8% | 15.8% |
| Interquartile 25% (IQ1) | 11.3% | 13.2% |
| Interquartile 75% (IQ3) | 16.6% | 19.2% |
| Interquartile Range (IQR) | 5.3% | 6.1% |
| Standard Deviation (Sample) | 6.8% | 6.4% |
| Standard Deviation (Population) | 6.7% | 6.4% |
Similar Demographics by Female Poverty
Demographics Similar to Nigerians by Female Poverty
In terms of female poverty, the demographic groups most similar to Nigerians are Alaska Native (14.7%, a difference of 0.10%), Ghanaian (14.7%, a difference of 0.30%), Osage (14.8%, a difference of 0.31%), German Russian (14.7%, a difference of 0.36%), and Immigrants from Saudi Arabia (14.8%, a difference of 0.41%).
| Demographics | Rating | Rank | Female Poverty |
| Americans | 2.8 /100 | #224 | Tragic 14.6% |
| Immigrants | Micronesia | 2.8 /100 | #225 | Tragic 14.6% |
| Immigrants | Eritrea | 2.4 /100 | #226 | Tragic 14.6% |
| Immigrants | Nigeria | 2.1 /100 | #227 | Tragic 14.7% |
| German Russians | 2.0 /100 | #228 | Tragic 14.7% |
| Ghanaians | 1.9 /100 | #229 | Tragic 14.7% |
| Alaska Natives | 1.8 /100 | #230 | Tragic 14.7% |
| Nigerians | 1.7 /100 | #231 | Tragic 14.8% |
| Osage | 1.5 /100 | #232 | Tragic 14.8% |
| Immigrants | Saudi Arabia | 1.4 /100 | #233 | Tragic 14.8% |
| Fijians | 1.1 /100 | #234 | Tragic 14.9% |
| Immigrants | Laos | 0.9 /100 | #235 | Tragic 15.0% |
| Cree | 0.7 /100 | #236 | Tragic 15.1% |
| French American Indians | 0.6 /100 | #237 | Tragic 15.1% |
| Immigrants | Armenia | 0.6 /100 | #238 | Tragic 15.1% |
Demographics Similar to Immigrants from Burma/Myanmar by Female Poverty
In terms of female poverty, the demographic groups most similar to Immigrants from Burma/Myanmar are Immigrants from Trinidad and Tobago (15.4%, a difference of 0.030%), Immigrants from Western Africa (15.3%, a difference of 0.19%), Salvadoran (15.3%, a difference of 0.23%), Liberian (15.4%, a difference of 0.26%), and Immigrants from Ghana (15.3%, a difference of 0.37%).
| Demographics | Rating | Rank | Female Poverty |
| Spanish American Indians | 0.3 /100 | #245 | Tragic 15.3% |
| Cubans | 0.3 /100 | #246 | Tragic 15.3% |
| Potawatomi | 0.3 /100 | #247 | Tragic 15.3% |
| Immigrants | Ghana | 0.3 /100 | #248 | Tragic 15.3% |
| Salvadorans | 0.3 /100 | #249 | Tragic 15.3% |
| Immigrants | Western Africa | 0.3 /100 | #250 | Tragic 15.3% |
| Immigrants | Trinidad and Tobago | 0.3 /100 | #251 | Tragic 15.4% |
| Immigrants | Burma/Myanmar | 0.3 /100 | #252 | Tragic 15.4% |
| Liberians | 0.2 /100 | #253 | Tragic 15.4% |
| Trinidadians and Tobagonians | 0.2 /100 | #254 | Tragic 15.4% |
| Ottawa | 0.2 /100 | #255 | Tragic 15.5% |
| Jamaicans | 0.2 /100 | #256 | Tragic 15.5% |
| Immigrants | Jamaica | 0.1 /100 | #257 | Tragic 15.6% |
| Shoshone | 0.1 /100 | #258 | Tragic 15.6% |
| Cape Verdeans | 0.1 /100 | #259 | Tragic 15.6% |