Paraguayan vs Immigrants from South America Child Poverty Among Girls Under 16
COMPARE
Paraguayan
Immigrants from South America
Child Poverty Among Girls Under 16
Child Poverty Among Girls Under 16 Comparison
Paraguayans
Immigrants from South America
15.0%
CHILD POVERTY AMONG GIRLS UNDER 16
95.7/ 100
METRIC RATING
100th/ 347
METRIC RANK
16.4%
CHILD POVERTY AMONG GIRLS UNDER 16
55.1/ 100
METRIC RATING
173rd/ 347
METRIC RANK
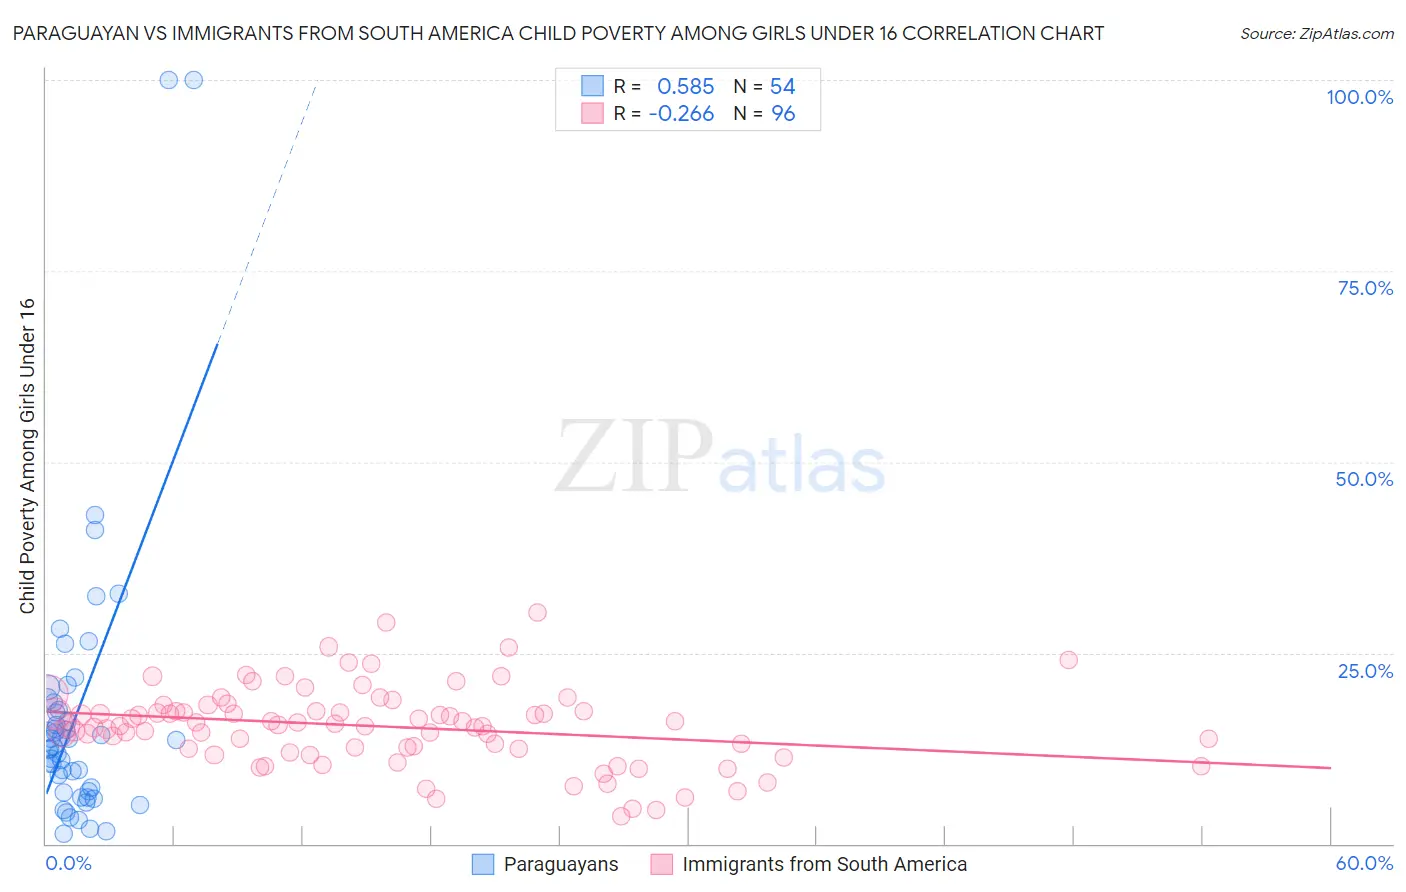
Paraguayan vs Immigrants from South America Child Poverty Among Girls Under 16 Correlation Chart
The statistical analysis conducted on geographies consisting of 94,658,687 people shows a substantial positive correlation between the proportion of Paraguayans and poverty level among girls under the age of 16 in the United States with a correlation coefficient (R) of 0.585 and weighted average of 15.0%. Similarly, the statistical analysis conducted on geographies consisting of 473,703,980 people shows a weak negative correlation between the proportion of Immigrants from South America and poverty level among girls under the age of 16 in the United States with a correlation coefficient (R) of -0.266 and weighted average of 16.4%, a difference of 9.1%.
Child Poverty Among Girls Under 16 Correlation Summary
| Measurement | Paraguayan | Immigrants from South America |
| Minimum | 1.2% | 3.7% |
| Maximum | 100.0% | 30.3% |
| Range | 98.8% | 26.7% |
| Mean | 17.1% | 15.4% |
| Median | 13.2% | 15.5% |
| Interquartile 25% (IQ1) | 6.9% | 12.5% |
| Interquartile 75% (IQ3) | 18.5% | 17.4% |
| Interquartile Range (IQR) | 11.6% | 4.9% |
| Standard Deviation (Sample) | 18.8% | 5.2% |
| Standard Deviation (Population) | 18.6% | 5.1% |
Similar Demographics by Child Poverty Among Girls Under 16
Demographics Similar to Paraguayans by Child Poverty Among Girls Under 16
In terms of child poverty among girls under 16, the demographic groups most similar to Paraguayans are Immigrants from South Africa (15.0%, a difference of 0.030%), Immigrants from Egypt (15.0%, a difference of 0.040%), Immigrants from Malaysia (15.0%, a difference of 0.050%), British (15.0%, a difference of 0.070%), and Basque (15.0%, a difference of 0.20%).
| Demographics | Rating | Rank | Child Poverty Among Girls Under 16 |
| Immigrants | North America | 96.6 /100 | #93 | Exceptional 14.9% |
| Immigrants | Switzerland | 96.3 /100 | #94 | Exceptional 14.9% |
| Germans | 96.3 /100 | #95 | Exceptional 14.9% |
| Immigrants | France | 96.2 /100 | #96 | Exceptional 14.9% |
| Immigrants | Latvia | 96.1 /100 | #97 | Exceptional 14.9% |
| Basques | 95.9 /100 | #98 | Exceptional 15.0% |
| Immigrants | Egypt | 95.7 /100 | #99 | Exceptional 15.0% |
| Paraguayans | 95.7 /100 | #100 | Exceptional 15.0% |
| Immigrants | South Africa | 95.6 /100 | #101 | Exceptional 15.0% |
| Immigrants | Malaysia | 95.6 /100 | #102 | Exceptional 15.0% |
| British | 95.6 /100 | #103 | Exceptional 15.0% |
| Romanians | 95.3 /100 | #104 | Exceptional 15.0% |
| Immigrants | England | 95.1 /100 | #105 | Exceptional 15.1% |
| Chileans | 95.1 /100 | #106 | Exceptional 15.1% |
| Immigrants | Ukraine | 95.0 /100 | #107 | Exceptional 15.1% |
Demographics Similar to Immigrants from South America by Child Poverty Among Girls Under 16
In terms of child poverty among girls under 16, the demographic groups most similar to Immigrants from South America are Ethiopian (16.5%, a difference of 0.59%), Afghan (16.2%, a difference of 0.88%), Immigrants from Saudi Arabia (16.2%, a difference of 1.1%), Costa Rican (16.2%, a difference of 1.1%), and Immigrants from Venezuela (16.2%, a difference of 1.1%).
| Demographics | Rating | Rank | Child Poverty Among Girls Under 16 |
| South Americans | 67.2 /100 | #166 | Good 16.1% |
| Uruguayans | 64.7 /100 | #167 | Good 16.2% |
| Yugoslavians | 64.4 /100 | #168 | Good 16.2% |
| Costa Ricans | 64.2 /100 | #169 | Good 16.2% |
| Immigrants | Venezuela | 64.2 /100 | #170 | Good 16.2% |
| Immigrants | Saudi Arabia | 64.0 /100 | #171 | Good 16.2% |
| Afghans | 62.3 /100 | #172 | Good 16.2% |
| Immigrants | South America | 55.1 /100 | #173 | Average 16.4% |
| Ethiopians | 50.0 /100 | #174 | Average 16.5% |
| Lebanese | 45.4 /100 | #175 | Average 16.6% |
| Hungarians | 45.1 /100 | #176 | Average 16.6% |
| Immigrants | Western Asia | 44.1 /100 | #177 | Average 16.6% |
| Whites/Caucasians | 43.6 /100 | #178 | Average 16.6% |
| Hawaiians | 43.4 /100 | #179 | Average 16.6% |
| Immigrants | Syria | 43.3 /100 | #180 | Average 16.6% |