Pima vs U.S. Virgin Islander Single Mother Poverty
COMPARE
Pima
U.S. Virgin Islander
Single Mother Poverty
Single Mother Poverty Comparison
Pima
U.S. Virgin Islanders
38.6%
SINGLE MOTHER POVERTY
0.0/ 100
METRIC RATING
338th/ 347
METRIC RANK
32.6%
SINGLE MOTHER POVERTY
0.0/ 100
METRIC RATING
289th/ 347
METRIC RANK
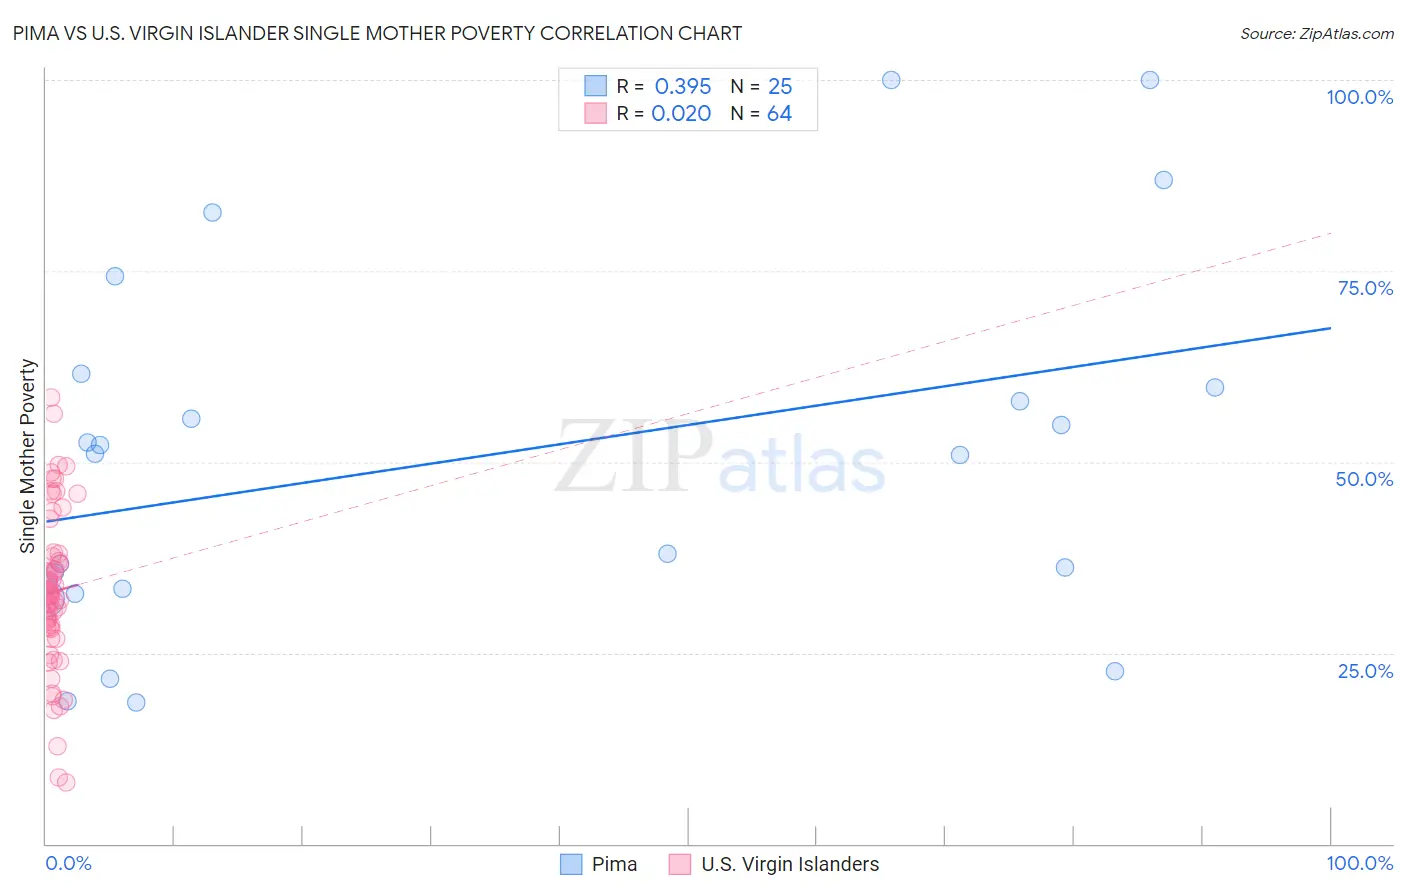
Pima vs U.S. Virgin Islander Single Mother Poverty Correlation Chart
The statistical analysis conducted on geographies consisting of 61,247,858 people shows a mild positive correlation between the proportion of Pima and poverty level among single mothers in the United States with a correlation coefficient (R) of 0.395 and weighted average of 38.6%. Similarly, the statistical analysis conducted on geographies consisting of 87,215,550 people shows no correlation between the proportion of U.S. Virgin Islanders and poverty level among single mothers in the United States with a correlation coefficient (R) of 0.020 and weighted average of 32.6%, a difference of 18.5%.
Single Mother Poverty Correlation Summary
| Measurement | Pima | U.S. Virgin Islander |
| Minimum | 18.5% | 8.0% |
| Maximum | 100.0% | 58.4% |
| Range | 81.5% | 50.4% |
| Mean | 50.6% | 33.0% |
| Median | 51.0% | 32.4% |
| Interquartile 25% (IQ1) | 33.1% | 28.2% |
| Interquartile 75% (IQ3) | 60.6% | 37.8% |
| Interquartile Range (IQR) | 27.5% | 9.6% |
| Standard Deviation (Sample) | 23.7% | 10.5% |
| Standard Deviation (Population) | 23.3% | 10.4% |
Similar Demographics by Single Mother Poverty
Demographics Similar to Pima by Single Mother Poverty
In terms of single mother poverty, the demographic groups most similar to Pima are Crow (38.6%, a difference of 0.090%), Immigrants from Yemen (38.5%, a difference of 0.21%), Cheyenne (38.5%, a difference of 0.25%), Sioux (38.8%, a difference of 0.49%), and Colville (39.3%, a difference of 1.8%).
| Demographics | Rating | Rank | Single Mother Poverty |
| Creek | 0.0 /100 | #331 | Tragic 36.7% |
| Dutch West Indians | 0.0 /100 | #332 | Tragic 36.8% |
| Menominee | 0.0 /100 | #333 | Tragic 37.1% |
| Pueblo | 0.0 /100 | #334 | Tragic 37.2% |
| Yuman | 0.0 /100 | #335 | Tragic 37.8% |
| Cheyenne | 0.0 /100 | #336 | Tragic 38.5% |
| Immigrants | Yemen | 0.0 /100 | #337 | Tragic 38.5% |
| Pima | 0.0 /100 | #338 | Tragic 38.6% |
| Crow | 0.0 /100 | #339 | Tragic 38.6% |
| Sioux | 0.0 /100 | #340 | Tragic 38.8% |
| Colville | 0.0 /100 | #341 | Tragic 39.3% |
| Navajo | 0.0 /100 | #342 | Tragic 40.2% |
| Cajuns | 0.0 /100 | #343 | Tragic 40.3% |
| Tohono O'odham | 0.0 /100 | #344 | Tragic 43.0% |
| Lumbee | 0.0 /100 | #345 | Tragic 43.2% |
Demographics Similar to U.S. Virgin Islanders by Single Mother Poverty
In terms of single mother poverty, the demographic groups most similar to U.S. Virgin Islanders are Somali (32.6%, a difference of 0.030%), Osage (32.6%, a difference of 0.11%), Immigrants from Dominica (32.5%, a difference of 0.25%), Yup'ik (32.5%, a difference of 0.38%), and Immigrants from Latin America (32.4%, a difference of 0.45%).
| Demographics | Rating | Rank | Single Mother Poverty |
| Immigrants | Azores | 0.0 /100 | #282 | Tragic 32.2% |
| Spanish Americans | 0.0 /100 | #283 | Tragic 32.3% |
| Indonesians | 0.0 /100 | #284 | Tragic 32.4% |
| Immigrants | Latin America | 0.0 /100 | #285 | Tragic 32.4% |
| Yup'ik | 0.0 /100 | #286 | Tragic 32.5% |
| Immigrants | Dominica | 0.0 /100 | #287 | Tragic 32.5% |
| Somalis | 0.0 /100 | #288 | Tragic 32.6% |
| U.S. Virgin Islanders | 0.0 /100 | #289 | Tragic 32.6% |
| Osage | 0.0 /100 | #290 | Tragic 32.6% |
| Guatemalans | 0.0 /100 | #291 | Tragic 32.9% |
| Shoshone | 0.0 /100 | #292 | Tragic 32.9% |
| Aleuts | 0.0 /100 | #293 | Tragic 32.9% |
| French American Indians | 0.0 /100 | #294 | Tragic 33.1% |
| Yaqui | 0.0 /100 | #295 | Tragic 33.1% |
| Blackfeet | 0.0 /100 | #296 | Tragic 33.2% |