Romanian vs Sierra Leonean Seniors Poverty Over the Age of 75
COMPARE
Romanian
Sierra Leonean
Seniors Poverty Over the Age of 75
Seniors Poverty Over the Age of 75 Comparison
Romanians
Sierra Leoneans
11.6%
SENIORS POVERTY OVER THE AGE OF 75
92.3/ 100
METRIC RATING
97th/ 347
METRIC RANK
11.4%
SENIORS POVERTY OVER THE AGE OF 75
96.1/ 100
METRIC RATING
72nd/ 347
METRIC RANK
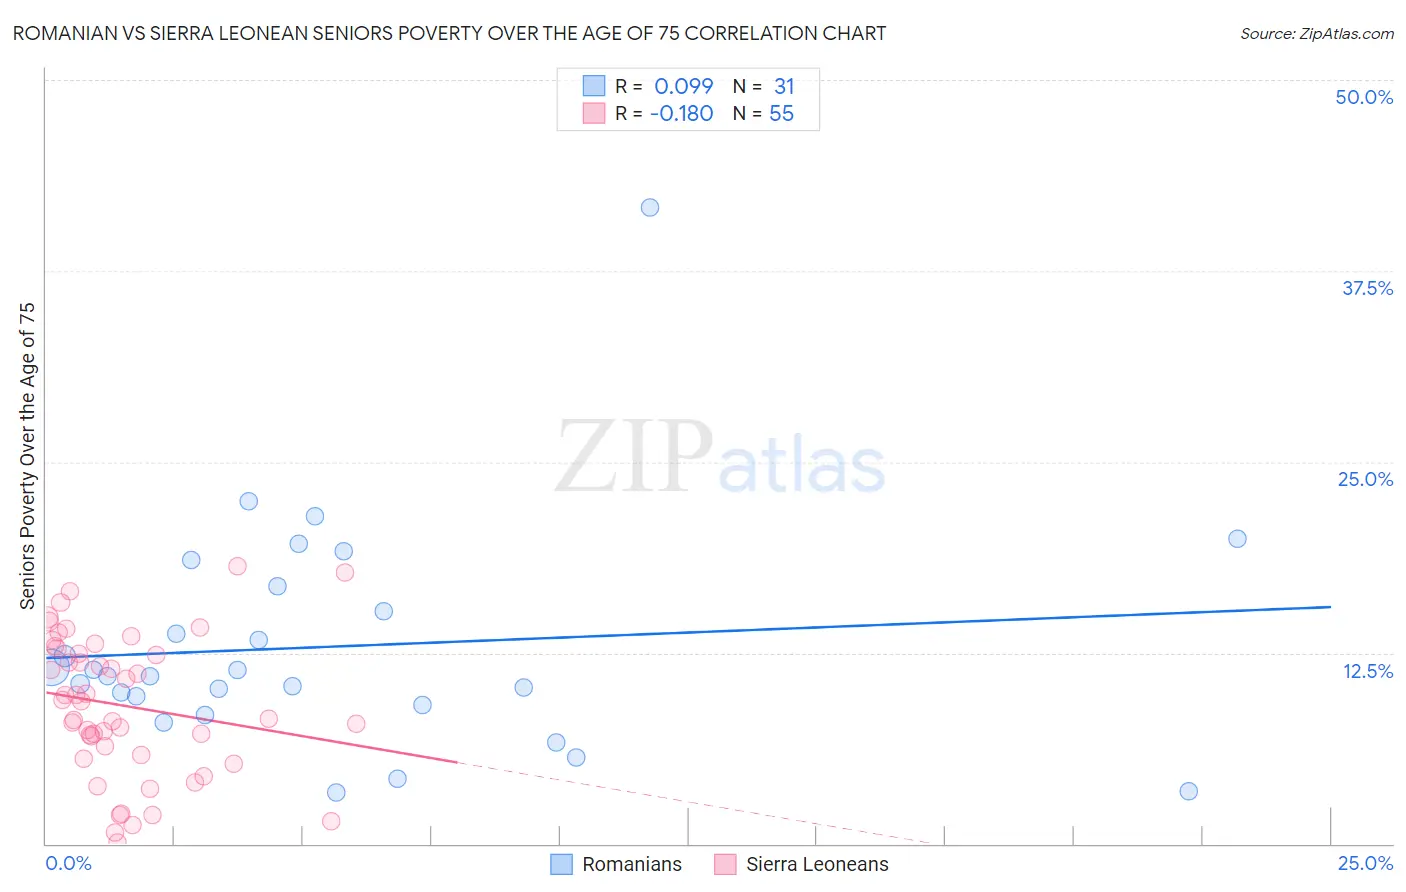
Romanian vs Sierra Leonean Seniors Poverty Over the Age of 75 Correlation Chart
The statistical analysis conducted on geographies consisting of 373,710,201 people shows a slight positive correlation between the proportion of Romanians and poverty level among seniors over the age of 75 in the United States with a correlation coefficient (R) of 0.099 and weighted average of 11.6%. Similarly, the statistical analysis conducted on geographies consisting of 83,077,533 people shows a poor negative correlation between the proportion of Sierra Leoneans and poverty level among seniors over the age of 75 in the United States with a correlation coefficient (R) of -0.180 and weighted average of 11.4%, a difference of 1.6%.
Seniors Poverty Over the Age of 75 Correlation Summary
| Measurement | Romanian | Sierra Leonean |
| Minimum | 3.3% | 0.097% |
| Maximum | 41.7% | 18.2% |
| Range | 38.3% | 18.1% |
| Mean | 12.9% | 9.0% |
| Median | 11.0% | 9.3% |
| Interquartile 25% (IQ1) | 9.1% | 5.8% |
| Interquartile 75% (IQ3) | 16.9% | 12.8% |
| Interquartile Range (IQR) | 7.8% | 6.9% |
| Standard Deviation (Sample) | 7.4% | 4.6% |
| Standard Deviation (Population) | 7.3% | 4.6% |
Similar Demographics by Seniors Poverty Over the Age of 75
Demographics Similar to Romanians by Seniors Poverty Over the Age of 75
In terms of seniors poverty over the age of 75, the demographic groups most similar to Romanians are Immigrants from Bosnia and Herzegovina (11.6%, a difference of 0.080%), Immigrants from Sweden (11.6%, a difference of 0.080%), Immigrants from Japan (11.6%, a difference of 0.11%), Creek (11.6%, a difference of 0.13%), and Immigrants from Poland (11.6%, a difference of 0.17%).
| Demographics | Rating | Rank | Seniors Poverty Over the Age of 75 |
| Aleuts | 94.1 /100 | #90 | Exceptional 11.5% |
| Immigrants | Germany | 94.1 /100 | #91 | Exceptional 11.5% |
| Kenyans | 93.9 /100 | #92 | Exceptional 11.5% |
| Immigrants | Poland | 92.9 /100 | #93 | Exceptional 11.6% |
| Creek | 92.7 /100 | #94 | Exceptional 11.6% |
| Immigrants | Bosnia and Herzegovina | 92.6 /100 | #95 | Exceptional 11.6% |
| Immigrants | Sweden | 92.6 /100 | #96 | Exceptional 11.6% |
| Romanians | 92.3 /100 | #97 | Exceptional 11.6% |
| Immigrants | Japan | 91.9 /100 | #98 | Exceptional 11.6% |
| Immigrants | Ethiopia | 91.7 /100 | #99 | Exceptional 11.6% |
| Syrians | 91.1 /100 | #100 | Exceptional 11.6% |
| Jordanians | 90.8 /100 | #101 | Exceptional 11.6% |
| Guamanians/Chamorros | 90.6 /100 | #102 | Exceptional 11.6% |
| Immigrants | Kuwait | 90.5 /100 | #103 | Exceptional 11.6% |
| Immigrants | Singapore | 90.3 /100 | #104 | Exceptional 11.6% |
Demographics Similar to Sierra Leoneans by Seniors Poverty Over the Age of 75
In terms of seniors poverty over the age of 75, the demographic groups most similar to Sierra Leoneans are Immigrants from Micronesia (11.4%, a difference of 0.090%), Osage (11.4%, a difference of 0.10%), Delaware (11.4%, a difference of 0.10%), Immigrants from South Central Asia (11.4%, a difference of 0.18%), and Palestinian (11.4%, a difference of 0.19%).
| Demographics | Rating | Rank | Seniors Poverty Over the Age of 75 |
| Immigrants | Taiwan | 96.7 /100 | #65 | Exceptional 11.4% |
| Estonians | 96.7 /100 | #66 | Exceptional 11.4% |
| Bolivians | 96.5 /100 | #67 | Exceptional 11.4% |
| Immigrants | Austria | 96.5 /100 | #68 | Exceptional 11.4% |
| Ottawa | 96.5 /100 | #69 | Exceptional 11.4% |
| Immigrants | South Central Asia | 96.4 /100 | #70 | Exceptional 11.4% |
| Osage | 96.3 /100 | #71 | Exceptional 11.4% |
| Sierra Leoneans | 96.1 /100 | #72 | Exceptional 11.4% |
| Immigrants | Micronesia | 96.0 /100 | #73 | Exceptional 11.4% |
| Delaware | 96.0 /100 | #74 | Exceptional 11.4% |
| Palestinians | 95.8 /100 | #75 | Exceptional 11.4% |
| French Canadians | 95.7 /100 | #76 | Exceptional 11.4% |
| Whites/Caucasians | 95.5 /100 | #77 | Exceptional 11.4% |
| Macedonians | 95.5 /100 | #78 | Exceptional 11.4% |
| Filipinos | 95.5 /100 | #79 | Exceptional 11.4% |