Russian vs Chinese Seniors Poverty Over the Age of 75
COMPARE
Russian
Chinese
Seniors Poverty Over the Age of 75
Seniors Poverty Over the Age of 75 Comparison
Russians
Chinese
11.6%
SENIORS POVERTY OVER THE AGE OF 75
89.9/ 100
METRIC RATING
106th/ 347
METRIC RANK
9.1%
SENIORS POVERTY OVER THE AGE OF 75
100.0/ 100
METRIC RATING
1st/ 347
METRIC RANK
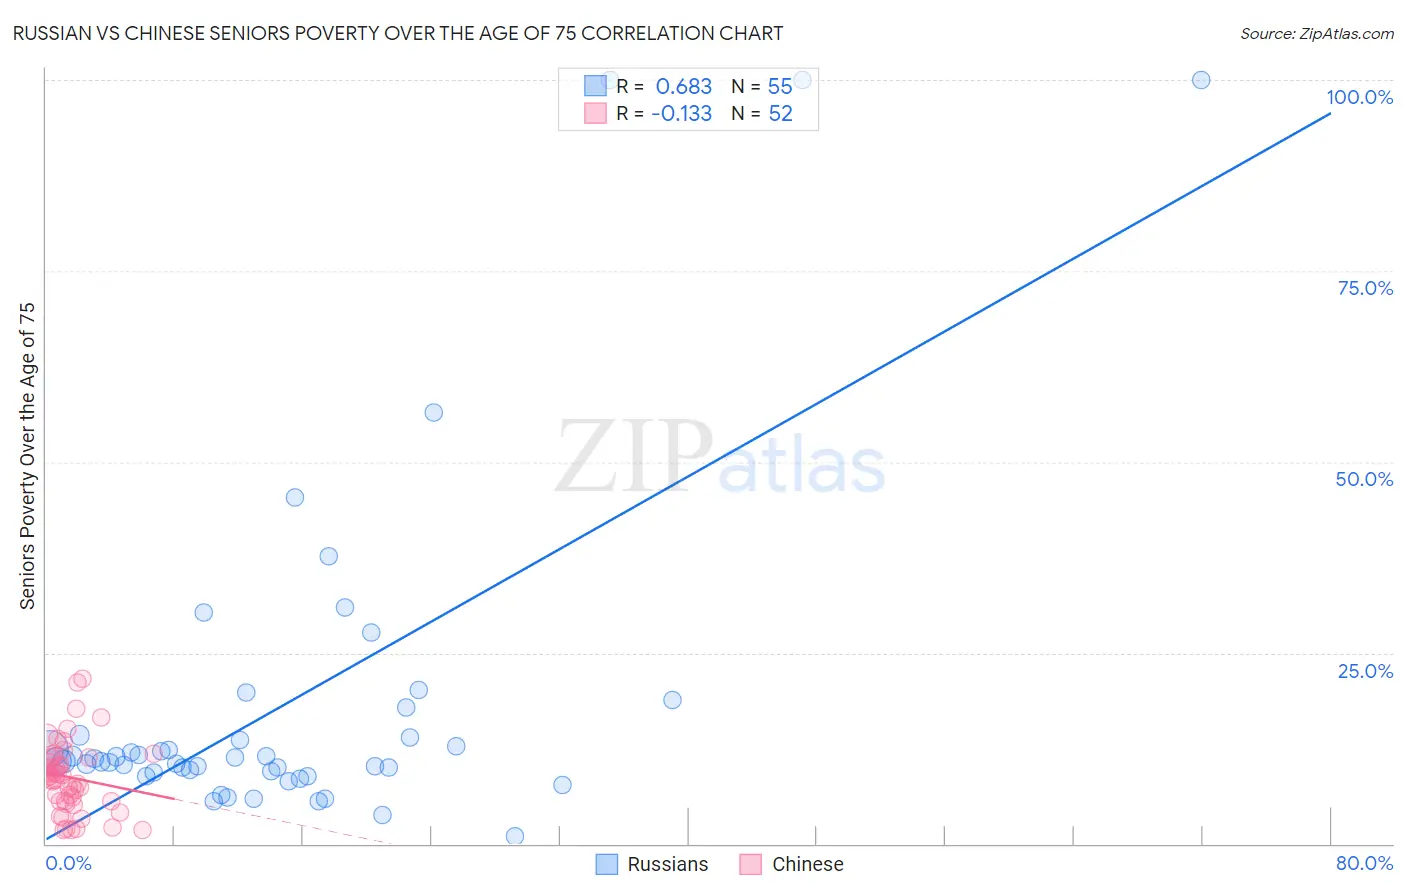
Russian vs Chinese Seniors Poverty Over the Age of 75 Correlation Chart
The statistical analysis conducted on geographies consisting of 501,147,306 people shows a significant positive correlation between the proportion of Russians and poverty level among seniors over the age of 75 in the United States with a correlation coefficient (R) of 0.683 and weighted average of 11.6%. Similarly, the statistical analysis conducted on geographies consisting of 64,532,572 people shows a poor negative correlation between the proportion of Chinese and poverty level among seniors over the age of 75 in the United States with a correlation coefficient (R) of -0.133 and weighted average of 9.1%, a difference of 28.4%.
Seniors Poverty Over the Age of 75 Correlation Summary
| Measurement | Russian | Chinese |
| Minimum | 1.1% | 1.7% |
| Maximum | 100.0% | 21.6% |
| Range | 98.9% | 19.9% |
| Mean | 18.4% | 8.7% |
| Median | 10.8% | 8.6% |
| Interquartile 25% (IQ1) | 9.4% | 5.5% |
| Interquartile 75% (IQ3) | 14.2% | 11.3% |
| Interquartile Range (IQR) | 4.8% | 5.8% |
| Standard Deviation (Sample) | 22.1% | 4.7% |
| Standard Deviation (Population) | 21.9% | 4.6% |
Similar Demographics by Seniors Poverty Over the Age of 75
Demographics Similar to Russians by Seniors Poverty Over the Age of 75
In terms of seniors poverty over the age of 75, the demographic groups most similar to Russians are Chickasaw (11.6%, a difference of 0.080%), Immigrants from Singapore (11.6%, a difference of 0.090%), Immigrants from Oceania (11.7%, a difference of 0.11%), Turkish (11.7%, a difference of 0.12%), and South African (11.7%, a difference of 0.13%).
| Demographics | Rating | Rank | Seniors Poverty Over the Age of 75 |
| Immigrants | Ethiopia | 91.7 /100 | #99 | Exceptional 11.6% |
| Syrians | 91.1 /100 | #100 | Exceptional 11.6% |
| Jordanians | 90.8 /100 | #101 | Exceptional 11.6% |
| Guamanians/Chamorros | 90.6 /100 | #102 | Exceptional 11.6% |
| Immigrants | Kuwait | 90.5 /100 | #103 | Exceptional 11.6% |
| Immigrants | Singapore | 90.3 /100 | #104 | Exceptional 11.6% |
| Chickasaw | 90.2 /100 | #105 | Exceptional 11.6% |
| Russians | 89.9 /100 | #106 | Excellent 11.6% |
| Immigrants | Oceania | 89.4 /100 | #107 | Excellent 11.7% |
| Turks | 89.4 /100 | #108 | Excellent 11.7% |
| South Africans | 89.3 /100 | #109 | Excellent 11.7% |
| Immigrants | Jordan | 88.7 /100 | #110 | Excellent 11.7% |
| Burmese | 88.7 /100 | #111 | Excellent 11.7% |
| Immigrants | Bolivia | 88.4 /100 | #112 | Excellent 11.7% |
| Immigrants | Czechoslovakia | 87.0 /100 | #113 | Excellent 11.7% |
Demographics Similar to Chinese by Seniors Poverty Over the Age of 75
In terms of seniors poverty over the age of 75, the demographic groups most similar to Chinese are Tlingit-Haida (9.7%, a difference of 7.0%), Native Hawaiian (10.1%, a difference of 11.1%), Swedish (10.2%, a difference of 12.0%), Norwegian (10.2%, a difference of 12.4%), and Danish (10.2%, a difference of 12.8%).
| Demographics | Rating | Rank | Seniors Poverty Over the Age of 75 |
| Chinese | 100.0 /100 | #1 | Exceptional 9.1% |
| Tlingit-Haida | 100.0 /100 | #2 | Exceptional 9.7% |
| Native Hawaiians | 100.0 /100 | #3 | Exceptional 10.1% |
| Swedes | 100.0 /100 | #4 | Exceptional 10.2% |
| Norwegians | 100.0 /100 | #5 | Exceptional 10.2% |
| Danes | 100.0 /100 | #6 | Exceptional 10.2% |
| Maltese | 100.0 /100 | #7 | Exceptional 10.3% |
| Germans | 99.9 /100 | #8 | Exceptional 10.4% |
| English | 99.9 /100 | #9 | Exceptional 10.4% |
| Scandinavians | 99.9 /100 | #10 | Exceptional 10.4% |
| Immigrants | India | 99.9 /100 | #11 | Exceptional 10.4% |
| Tongans | 99.9 /100 | #12 | Exceptional 10.5% |
| Croatians | 99.9 /100 | #13 | Exceptional 10.5% |
| Scottish | 99.9 /100 | #14 | Exceptional 10.5% |
| Europeans | 99.9 /100 | #15 | Exceptional 10.5% |