Senegalese vs Finnish Female Poverty
COMPARE
Senegalese
Finnish
Female Poverty
Female Poverty Comparison
Senegalese
Finns
16.5%
FEMALE POVERTY
0.0/ 100
METRIC RATING
295th/ 347
METRIC RANK
12.4%
FEMALE POVERTY
96.4/ 100
METRIC RATING
88th/ 347
METRIC RANK
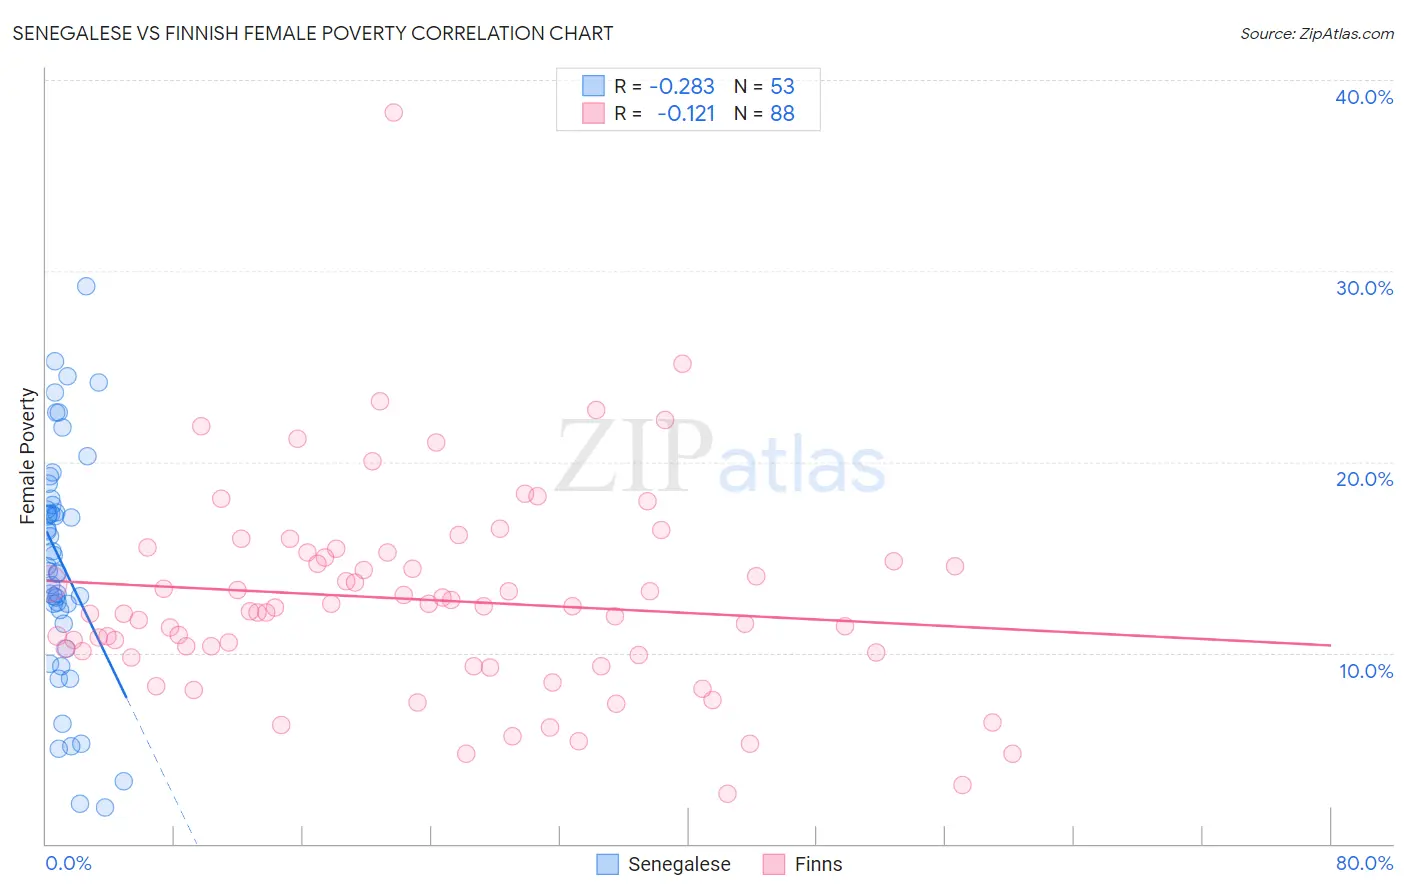
Senegalese vs Finnish Female Poverty Correlation Chart
The statistical analysis conducted on geographies consisting of 78,099,565 people shows a weak negative correlation between the proportion of Senegalese and poverty level among females in the United States with a correlation coefficient (R) of -0.283 and weighted average of 16.5%. Similarly, the statistical analysis conducted on geographies consisting of 404,419,462 people shows a poor negative correlation between the proportion of Finns and poverty level among females in the United States with a correlation coefficient (R) of -0.121 and weighted average of 12.4%, a difference of 32.9%.
Female Poverty Correlation Summary
| Measurement | Senegalese | Finnish |
| Minimum | 1.9% | 2.6% |
| Maximum | 29.2% | 38.3% |
| Range | 27.3% | 35.7% |
| Mean | 14.7% | 12.8% |
| Median | 14.5% | 12.3% |
| Interquartile 25% (IQ1) | 11.9% | 9.9% |
| Interquartile 75% (IQ3) | 17.9% | 15.1% |
| Interquartile Range (IQR) | 6.0% | 5.2% |
| Standard Deviation (Sample) | 6.1% | 5.4% |
| Standard Deviation (Population) | 6.0% | 5.3% |
Similar Demographics by Female Poverty
Demographics Similar to Senegalese by Female Poverty
In terms of female poverty, the demographic groups most similar to Senegalese are Immigrants from Senegal (16.5%, a difference of 0.020%), Immigrants from Cabo Verde (16.4%, a difference of 0.080%), Immigrants from Latin America (16.4%, a difference of 0.11%), Immigrants from Zaire (16.4%, a difference of 0.17%), and Yaqui (16.4%, a difference of 0.18%).
| Demographics | Rating | Rank | Female Poverty |
| Indonesians | 0.0 /100 | #288 | Tragic 16.4% |
| Blackfeet | 0.0 /100 | #289 | Tragic 16.4% |
| Immigrants | Bangladesh | 0.0 /100 | #290 | Tragic 16.4% |
| Yaqui | 0.0 /100 | #291 | Tragic 16.4% |
| Immigrants | Zaire | 0.0 /100 | #292 | Tragic 16.4% |
| Immigrants | Latin America | 0.0 /100 | #293 | Tragic 16.4% |
| Immigrants | Cabo Verde | 0.0 /100 | #294 | Tragic 16.4% |
| Senegalese | 0.0 /100 | #295 | Tragic 16.5% |
| Immigrants | Senegal | 0.0 /100 | #296 | Tragic 16.5% |
| Mexicans | 0.0 /100 | #297 | Tragic 16.5% |
| Somalis | 0.0 /100 | #298 | Tragic 16.6% |
| Hispanics or Latinos | 0.0 /100 | #299 | Tragic 16.6% |
| Bahamians | 0.0 /100 | #300 | Tragic 16.6% |
| Guatemalans | 0.0 /100 | #301 | Tragic 16.7% |
| Chippewa | 0.0 /100 | #302 | Tragic 16.7% |
Demographics Similar to Finns by Female Poverty
In terms of female poverty, the demographic groups most similar to Finns are Okinawan (12.4%, a difference of 0.050%), Dutch (12.4%, a difference of 0.060%), Irish (12.4%, a difference of 0.090%), Northern European (12.4%, a difference of 0.15%), and English (12.4%, a difference of 0.20%).
| Demographics | Rating | Rank | Female Poverty |
| Immigrants | Sweden | 97.1 /100 | #81 | Exceptional 12.3% |
| Jordanians | 97.1 /100 | #82 | Exceptional 12.3% |
| Immigrants | England | 96.9 /100 | #83 | Exceptional 12.3% |
| Northern Europeans | 96.6 /100 | #84 | Exceptional 12.4% |
| Irish | 96.5 /100 | #85 | Exceptional 12.4% |
| Dutch | 96.5 /100 | #86 | Exceptional 12.4% |
| Okinawans | 96.4 /100 | #87 | Exceptional 12.4% |
| Finns | 96.4 /100 | #88 | Exceptional 12.4% |
| English | 96.1 /100 | #89 | Exceptional 12.4% |
| Immigrants | Denmark | 95.8 /100 | #90 | Exceptional 12.4% |
| Belgians | 95.8 /100 | #91 | Exceptional 12.4% |
| Czechoslovakians | 95.7 /100 | #92 | Exceptional 12.4% |
| Immigrants | Egypt | 95.5 /100 | #93 | Exceptional 12.5% |
| Immigrants | Indonesia | 95.4 /100 | #94 | Exceptional 12.5% |
| Immigrants | South Africa | 95.4 /100 | #95 | Exceptional 12.5% |