Slavic vs Immigrants from Nepal Child Poverty Under the Age of 5
COMPARE
Slavic
Immigrants from Nepal
Child Poverty Under the Age of 5
Child Poverty Under the Age of 5 Comparison
Slavs
Immigrants from Nepal
17.0%
CHILD POVERTY UNDER THE AGE OF 5
64.0/ 100
METRIC RATING
166th/ 347
METRIC RANK
16.6%
CHILD POVERTY UNDER THE AGE OF 5
80.3/ 100
METRIC RATING
147th/ 347
METRIC RANK
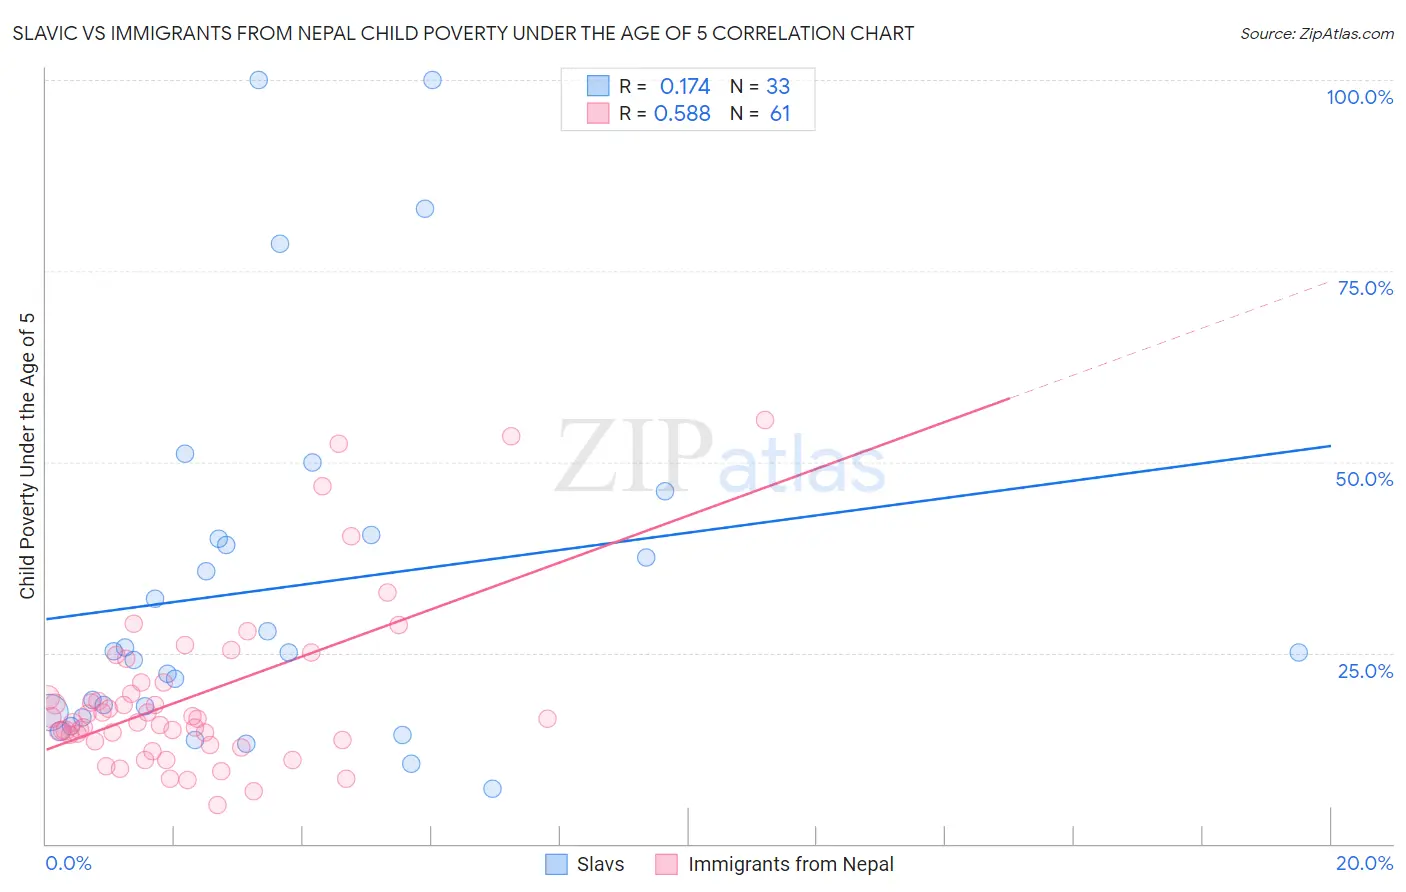
Slavic vs Immigrants from Nepal Child Poverty Under the Age of 5 Correlation Chart
The statistical analysis conducted on geographies consisting of 261,045,487 people shows a poor positive correlation between the proportion of Slavs and poverty level among children under the age of 5 in the United States with a correlation coefficient (R) of 0.174 and weighted average of 17.0%. Similarly, the statistical analysis conducted on geographies consisting of 183,030,738 people shows a substantial positive correlation between the proportion of Immigrants from Nepal and poverty level among children under the age of 5 in the United States with a correlation coefficient (R) of 0.588 and weighted average of 16.6%, a difference of 2.2%.
Child Poverty Under the Age of 5 Correlation Summary
| Measurement | Slavic | Immigrants from Nepal |
| Minimum | 7.2% | 5.1% |
| Maximum | 100.0% | 55.6% |
| Range | 92.8% | 50.5% |
| Mean | 33.6% | 19.2% |
| Median | 25.0% | 16.4% |
| Interquartile 25% (IQ1) | 16.9% | 13.5% |
| Interquartile 75% (IQ3) | 40.2% | 21.2% |
| Interquartile Range (IQR) | 23.3% | 7.6% |
| Standard Deviation (Sample) | 24.5% | 10.9% |
| Standard Deviation (Population) | 24.1% | 10.8% |
Demographics Similar to Slavs and Immigrants from Nepal by Child Poverty Under the Age of 5
In terms of child poverty under the age of 5, the demographic groups most similar to Slavs are Immigrants from Colombia (16.9%, a difference of 0.34%), Immigrants from Oceania (16.9%, a difference of 0.43%), Scottish (16.9%, a difference of 0.56%), Costa Rican (16.9%, a difference of 0.71%), and English (16.8%, a difference of 0.77%). Similarly, the demographic groups most similar to Immigrants from Nepal are Syrian (16.6%, a difference of 0.19%), New Zealander (16.6%, a difference of 0.25%), Israeli (16.6%, a difference of 0.31%), Colombian (16.7%, a difference of 0.40%), and Canadian (16.7%, a difference of 0.43%).
| Demographics | Rating | Rank | Child Poverty Under the Age of 5 |
| Israelis | 82.0 /100 | #146 | Excellent 16.6% |
| Immigrants | Nepal | 80.3 /100 | #147 | Excellent 16.6% |
| Syrians | 79.1 /100 | #148 | Good 16.6% |
| New Zealanders | 78.7 /100 | #149 | Good 16.6% |
| Colombians | 77.8 /100 | #150 | Good 16.7% |
| Canadians | 77.6 /100 | #151 | Good 16.7% |
| Belgians | 77.2 /100 | #152 | Good 16.7% |
| Dutch | 77.1 /100 | #153 | Good 16.7% |
| Immigrants | Venezuela | 76.0 /100 | #154 | Good 16.7% |
| South Americans | 75.1 /100 | #155 | Good 16.7% |
| Afghans | 74.4 /100 | #156 | Good 16.8% |
| Venezuelans | 73.7 /100 | #157 | Good 16.8% |
| Czechoslovakians | 72.5 /100 | #158 | Good 16.8% |
| Immigrants | Syria | 72.3 /100 | #159 | Good 16.8% |
| Irish | 72.0 /100 | #160 | Good 16.8% |
| English | 70.4 /100 | #161 | Good 16.8% |
| Costa Ricans | 69.8 /100 | #162 | Good 16.9% |
| Scottish | 68.6 /100 | #163 | Good 16.9% |
| Immigrants | Oceania | 67.6 /100 | #164 | Good 16.9% |
| Immigrants | Colombia | 66.9 /100 | #165 | Good 16.9% |
| Slavs | 64.0 /100 | #166 | Good 17.0% |