Slovak vs Slovene Single Male Poverty
COMPARE
Slovak
Slovene
Single Male Poverty
Single Male Poverty Comparison
Slovaks
Slovenes
14.1%
SINGLE MALE POVERTY
0.0/ 100
METRIC RATING
278th/ 347
METRIC RANK
13.0%
SINGLE MALE POVERTY
21.6/ 100
METRIC RATING
200th/ 347
METRIC RANK
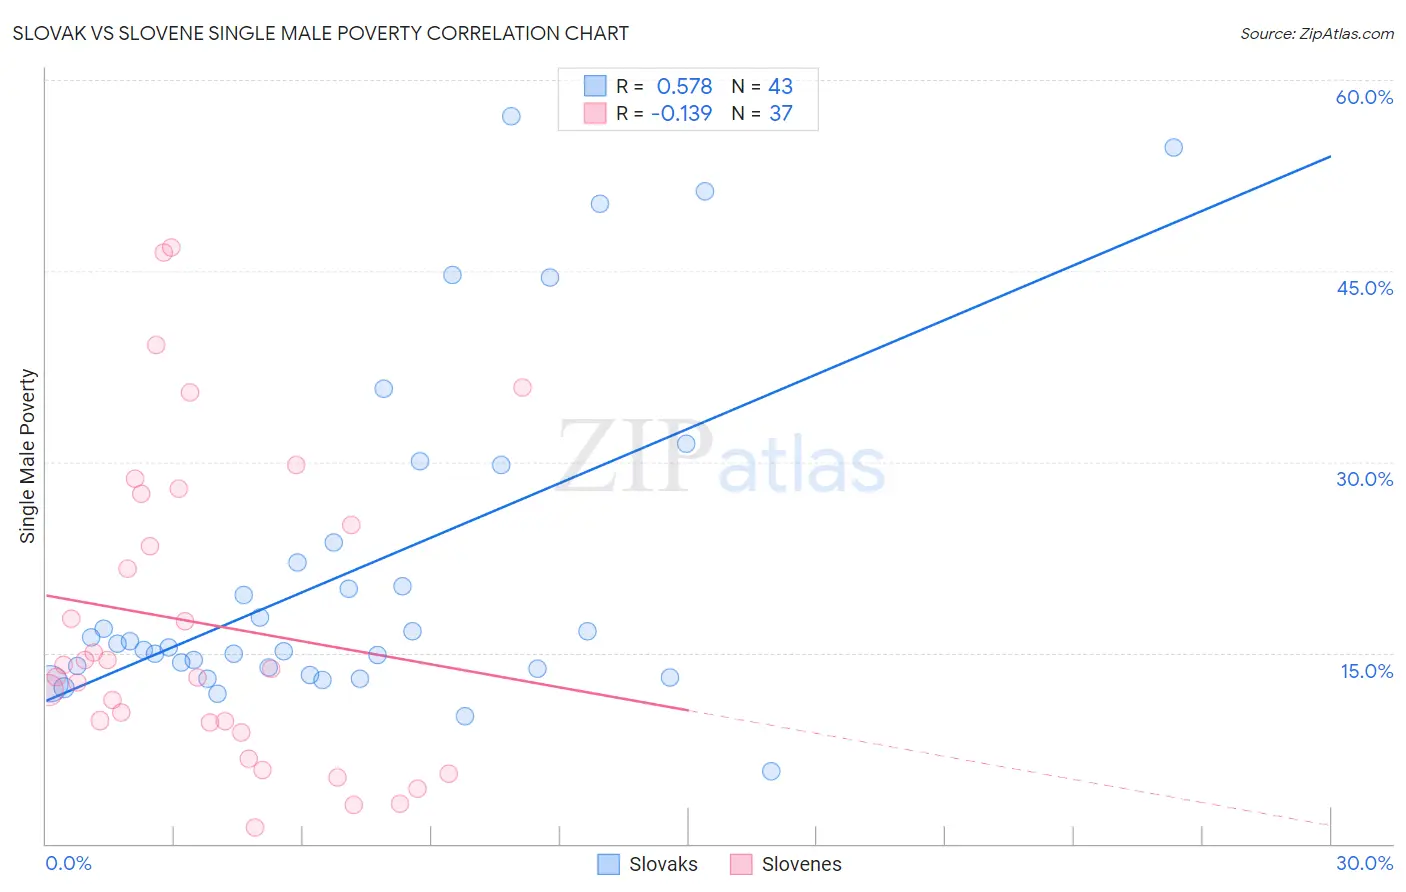
Slovak vs Slovene Single Male Poverty Correlation Chart
The statistical analysis conducted on geographies consisting of 343,124,767 people shows a substantial positive correlation between the proportion of Slovaks and poverty level among single males in the United States with a correlation coefficient (R) of 0.578 and weighted average of 14.1%. Similarly, the statistical analysis conducted on geographies consisting of 233,782,721 people shows a poor negative correlation between the proportion of Slovenes and poverty level among single males in the United States with a correlation coefficient (R) of -0.139 and weighted average of 13.0%, a difference of 8.3%.
Single Male Poverty Correlation Summary
| Measurement | Slovak | Slovene |
| Minimum | 5.7% | 1.3% |
| Maximum | 57.1% | 46.9% |
| Range | 51.4% | 45.6% |
| Mean | 21.6% | 17.3% |
| Median | 15.7% | 13.7% |
| Interquartile 25% (IQ1) | 13.8% | 9.2% |
| Interquartile 75% (IQ3) | 23.6% | 26.2% |
| Interquartile Range (IQR) | 9.9% | 17.1% |
| Standard Deviation (Sample) | 13.2% | 12.1% |
| Standard Deviation (Population) | 13.0% | 12.0% |
Similar Demographics by Single Male Poverty
Demographics Similar to Slovaks by Single Male Poverty
In terms of single male poverty, the demographic groups most similar to Slovaks are Indonesian (14.1%, a difference of 0.040%), Immigrants from Honduras (14.1%, a difference of 0.060%), Dutch (14.1%, a difference of 0.10%), English (14.1%, a difference of 0.22%), and Honduran (14.0%, a difference of 0.30%).
| Demographics | Rating | Rank | Single Male Poverty |
| Irish | 0.1 /100 | #271 | Tragic 14.0% |
| Mexicans | 0.1 /100 | #272 | Tragic 14.0% |
| Welsh | 0.1 /100 | #273 | Tragic 14.0% |
| Hondurans | 0.1 /100 | #274 | Tragic 14.0% |
| English | 0.1 /100 | #275 | Tragic 14.1% |
| Dutch | 0.1 /100 | #276 | Tragic 14.1% |
| Immigrants | Honduras | 0.0 /100 | #277 | Tragic 14.1% |
| Slovaks | 0.0 /100 | #278 | Tragic 14.1% |
| Indonesians | 0.0 /100 | #279 | Tragic 14.1% |
| Hmong | 0.0 /100 | #280 | Tragic 14.2% |
| Hispanics or Latinos | 0.0 /100 | #281 | Tragic 14.2% |
| Spanish Americans | 0.0 /100 | #282 | Tragic 14.2% |
| Yaqui | 0.0 /100 | #283 | Tragic 14.2% |
| Immigrants | Bahamas | 0.0 /100 | #284 | Tragic 14.4% |
| French | 0.0 /100 | #285 | Tragic 14.4% |
Demographics Similar to Slovenes by Single Male Poverty
In terms of single male poverty, the demographic groups most similar to Slovenes are Trinidadian and Tobagonian (13.0%, a difference of 0.010%), Immigrants from Norway (13.0%, a difference of 0.020%), Lithuanian (13.0%, a difference of 0.040%), Basque (13.0%, a difference of 0.070%), and Immigrants from Bangladesh (13.0%, a difference of 0.10%).
| Demographics | Rating | Rank | Single Male Poverty |
| Immigrants | South Africa | 26.1 /100 | #193 | Fair 13.0% |
| Liberians | 25.2 /100 | #194 | Fair 13.0% |
| Immigrants | England | 23.4 /100 | #195 | Fair 13.0% |
| Immigrants | Grenada | 23.1 /100 | #196 | Fair 13.0% |
| Immigrants | Laos | 23.1 /100 | #197 | Fair 13.0% |
| Lithuanians | 22.1 /100 | #198 | Fair 13.0% |
| Immigrants | Norway | 21.8 /100 | #199 | Fair 13.0% |
| Slovenes | 21.6 /100 | #200 | Fair 13.0% |
| Trinidadians and Tobagonians | 21.4 /100 | #201 | Fair 13.0% |
| Basques | 20.7 /100 | #202 | Fair 13.0% |
| Immigrants | Bangladesh | 20.4 /100 | #203 | Fair 13.0% |
| Estonians | 20.3 /100 | #204 | Fair 13.0% |
| Poles | 19.3 /100 | #205 | Poor 13.0% |
| Northern Europeans | 18.9 /100 | #206 | Poor 13.0% |
| Sudanese | 17.7 /100 | #207 | Poor 13.1% |