South African vs Thai Female Poverty
COMPARE
South African
Thai
Female Poverty
Female Poverty Comparison
South Africans
Thais
12.8%
FEMALE POVERTY
88.4/ 100
METRIC RATING
127th/ 347
METRIC RANK
10.5%
FEMALE POVERTY
100.0/ 100
METRIC RATING
3rd/ 347
METRIC RANK
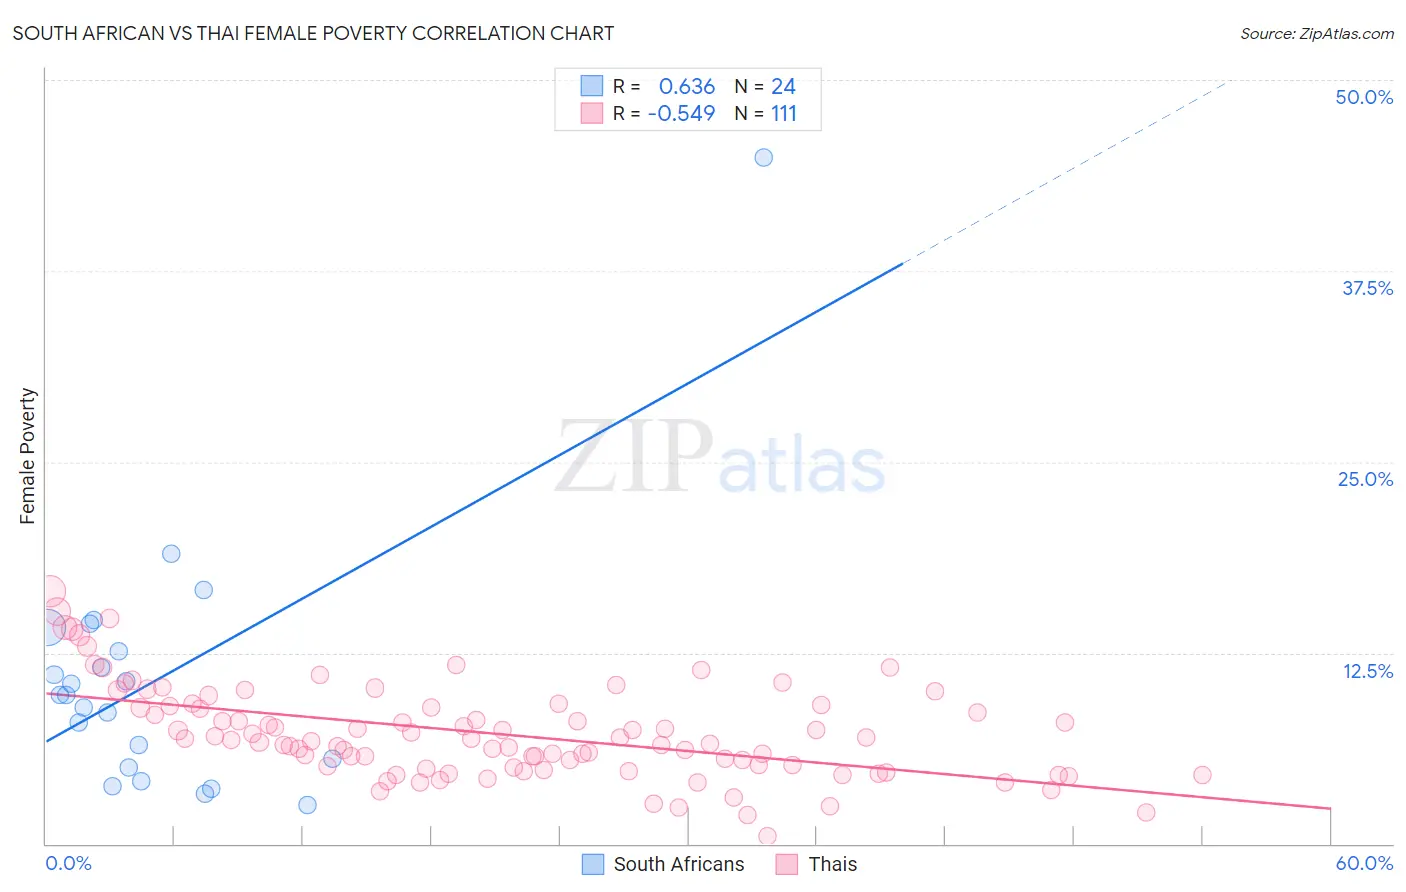
South African vs Thai Female Poverty Correlation Chart
The statistical analysis conducted on geographies consisting of 182,540,648 people shows a significant positive correlation between the proportion of South Africans and poverty level among females in the United States with a correlation coefficient (R) of 0.636 and weighted average of 12.8%. Similarly, the statistical analysis conducted on geographies consisting of 475,222,247 people shows a substantial negative correlation between the proportion of Thais and poverty level among females in the United States with a correlation coefficient (R) of -0.549 and weighted average of 10.5%, a difference of 22.3%.
Female Poverty Correlation Summary
| Measurement | South African | Thai |
| Minimum | 2.6% | 0.46% |
| Maximum | 44.9% | 16.5% |
| Range | 42.4% | 16.0% |
| Mean | 10.8% | 7.2% |
| Median | 9.7% | 6.8% |
| Interquartile 25% (IQ1) | 5.3% | 5.0% |
| Interquartile 75% (IQ3) | 13.4% | 9.0% |
| Interquartile Range (IQR) | 8.1% | 4.0% |
| Standard Deviation (Sample) | 8.5% | 3.1% |
| Standard Deviation (Population) | 8.4% | 3.0% |
Similar Demographics by Female Poverty
Demographics Similar to South Africans by Female Poverty
In terms of female poverty, the demographic groups most similar to South Africans are Immigrants from Belarus (12.8%, a difference of 0.040%), Immigrants from Ukraine (12.8%, a difference of 0.11%), Immigrants from Brazil (12.8%, a difference of 0.11%), Argentinean (12.8%, a difference of 0.18%), and Immigrants from Norway (12.8%, a difference of 0.23%).
| Demographics | Rating | Rank | Female Poverty |
| New Zealanders | 90.6 /100 | #120 | Exceptional 12.7% |
| Immigrants | Hungary | 90.3 /100 | #121 | Exceptional 12.7% |
| French Canadians | 90.2 /100 | #122 | Exceptional 12.7% |
| Immigrants | South Eastern Asia | 89.9 /100 | #123 | Excellent 12.7% |
| Immigrants | Norway | 89.3 /100 | #124 | Excellent 12.8% |
| Argentineans | 89.1 /100 | #125 | Excellent 12.8% |
| Immigrants | Ukraine | 88.8 /100 | #126 | Excellent 12.8% |
| South Africans | 88.4 /100 | #127 | Excellent 12.8% |
| Immigrants | Belarus | 88.2 /100 | #128 | Excellent 12.8% |
| Immigrants | Brazil | 87.9 /100 | #129 | Excellent 12.8% |
| Immigrants | Vietnam | 87.1 /100 | #130 | Excellent 12.8% |
| Immigrants | Argentina | 87.0 /100 | #131 | Excellent 12.8% |
| Immigrants | Jordan | 86.9 /100 | #132 | Excellent 12.8% |
| Immigrants | Western Europe | 86.6 /100 | #133 | Excellent 12.8% |
| Immigrants | Switzerland | 85.8 /100 | #134 | Excellent 12.9% |
Demographics Similar to Thais by Female Poverty
In terms of female poverty, the demographic groups most similar to Thais are Chinese (10.4%, a difference of 0.65%), Immigrants from Taiwan (10.5%, a difference of 0.76%), Filipino (10.9%, a difference of 4.7%), Immigrants from Ireland (11.0%, a difference of 5.1%), and Assyrian/Chaldean/Syriac (11.0%, a difference of 5.5%).
| Demographics | Rating | Rank | Female Poverty |
| Immigrants | India | 100.0 /100 | #1 | Exceptional 9.9% |
| Chinese | 100.0 /100 | #2 | Exceptional 10.4% |
| Thais | 100.0 /100 | #3 | Exceptional 10.5% |
| Immigrants | Taiwan | 100.0 /100 | #4 | Exceptional 10.5% |
| Filipinos | 100.0 /100 | #5 | Exceptional 10.9% |
| Immigrants | Ireland | 99.9 /100 | #6 | Exceptional 11.0% |
| Assyrians/Chaldeans/Syriacs | 99.9 /100 | #7 | Exceptional 11.0% |
| Immigrants | South Central Asia | 99.9 /100 | #8 | Exceptional 11.1% |
| Bulgarians | 99.9 /100 | #9 | Exceptional 11.1% |
| Immigrants | Hong Kong | 99.9 /100 | #10 | Exceptional 11.2% |
| Maltese | 99.9 /100 | #11 | Exceptional 11.2% |
| Bhutanese | 99.9 /100 | #12 | Exceptional 11.3% |
| Immigrants | Lithuania | 99.9 /100 | #13 | Exceptional 11.3% |
| Lithuanians | 99.8 /100 | #14 | Exceptional 11.4% |
| Latvians | 99.8 /100 | #15 | Exceptional 11.4% |