South American Indian vs Sioux Male Poverty
COMPARE
South American Indian
Sioux
Male Poverty
Male Poverty Comparison
South American Indians
Sioux
11.5%
MALE POVERTY
22.8/ 100
METRIC RATING
191st/ 347
METRIC RANK
18.7%
MALE POVERTY
0.0/ 100
METRIC RATING
337th/ 347
METRIC RANK
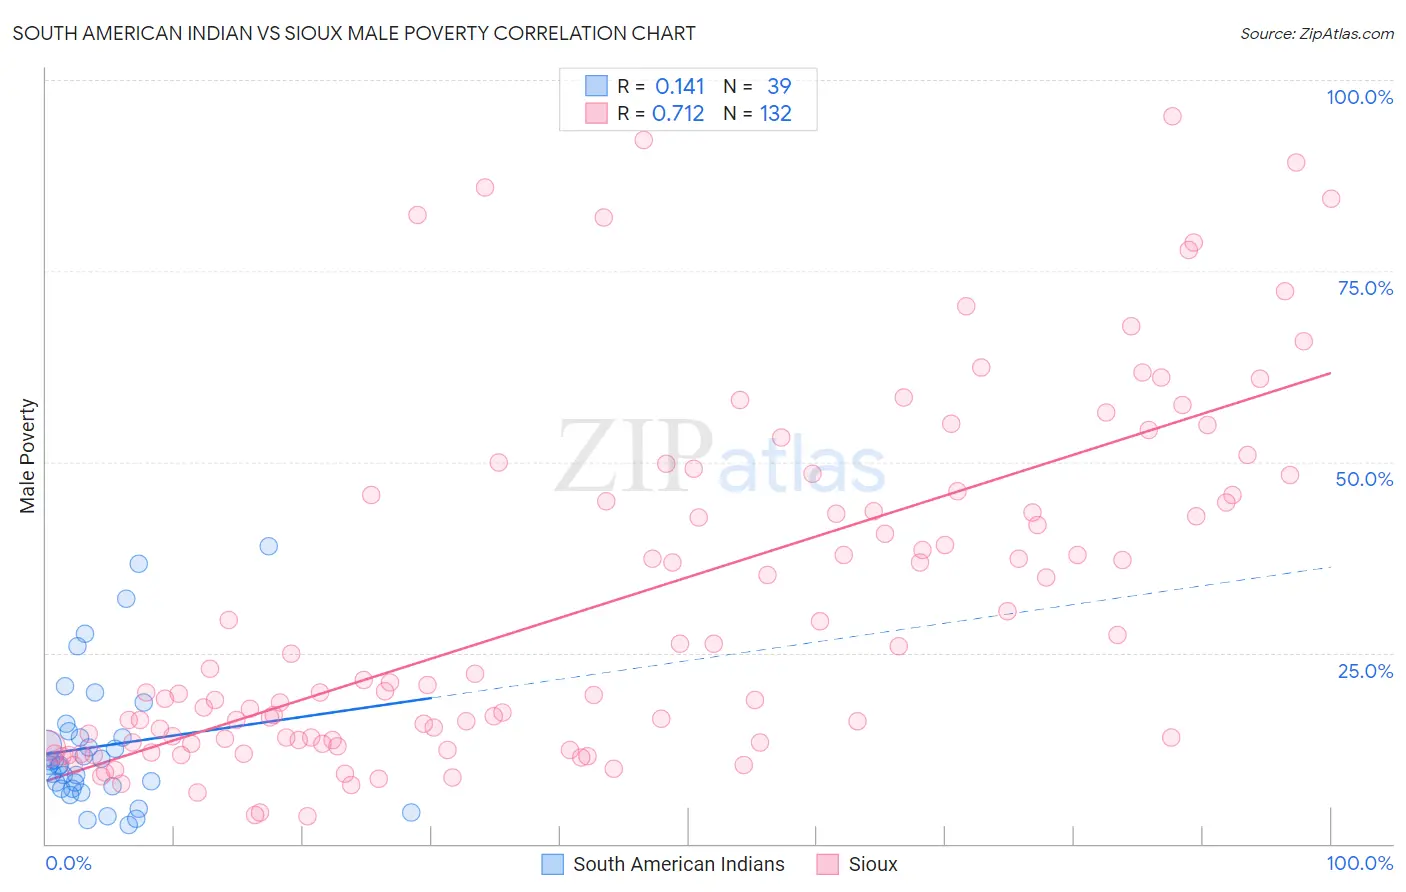
South American Indian vs Sioux Male Poverty Correlation Chart
The statistical analysis conducted on geographies consisting of 164,512,423 people shows a poor positive correlation between the proportion of South American Indians and poverty level among males in the United States with a correlation coefficient (R) of 0.141 and weighted average of 11.5%. Similarly, the statistical analysis conducted on geographies consisting of 234,075,552 people shows a strong positive correlation between the proportion of Sioux and poverty level among males in the United States with a correlation coefficient (R) of 0.712 and weighted average of 18.7%, a difference of 62.3%.
Male Poverty Correlation Summary
| Measurement | South American Indian | Sioux |
| Minimum | 2.4% | 3.5% |
| Maximum | 38.9% | 95.3% |
| Range | 36.5% | 91.7% |
| Mean | 12.8% | 31.5% |
| Median | 10.3% | 20.9% |
| Interquartile 25% (IQ1) | 7.1% | 13.4% |
| Interquartile 75% (IQ3) | 14.7% | 45.7% |
| Interquartile Range (IQR) | 7.6% | 32.2% |
| Standard Deviation (Sample) | 8.9% | 22.7% |
| Standard Deviation (Population) | 8.8% | 22.6% |
Similar Demographics by Male Poverty
Demographics Similar to South American Indians by Male Poverty
In terms of male poverty, the demographic groups most similar to South American Indians are Israeli (11.5%, a difference of 0.43%), Immigrants from Uruguay (11.6%, a difference of 0.52%), Hawaiian (11.4%, a difference of 0.70%), Immigrants from Kuwait (11.6%, a difference of 0.81%), and Sierra Leonean (11.4%, a difference of 0.88%).
| Demographics | Rating | Rank | Male Poverty |
| Immigrants | South America | 36.9 /100 | #184 | Fair 11.3% |
| Immigrants | Afghanistan | 33.3 /100 | #185 | Fair 11.4% |
| Immigrants | Sierra Leone | 32.9 /100 | #186 | Fair 11.4% |
| Immigrants | Iraq | 31.9 /100 | #187 | Fair 11.4% |
| Sierra Leoneans | 29.9 /100 | #188 | Fair 11.4% |
| Hawaiians | 28.3 /100 | #189 | Fair 11.4% |
| Israelis | 26.1 /100 | #190 | Fair 11.5% |
| South American Indians | 22.8 /100 | #191 | Fair 11.5% |
| Immigrants | Uruguay | 19.1 /100 | #192 | Poor 11.6% |
| Immigrants | Kuwait | 17.3 /100 | #193 | Poor 11.6% |
| Immigrants | Kenya | 16.1 /100 | #194 | Poor 11.6% |
| Arabs | 15.8 /100 | #195 | Poor 11.6% |
| Hmong | 15.8 /100 | #196 | Poor 11.6% |
| Delaware | 15.4 /100 | #197 | Poor 11.7% |
| Iraqis | 14.7 /100 | #198 | Poor 11.7% |
Demographics Similar to Sioux by Male Poverty
In terms of male poverty, the demographic groups most similar to Sioux are Pueblo (18.5%, a difference of 1.1%), Crow (19.1%, a difference of 2.3%), Yuman (19.5%, a difference of 4.5%), Apache (17.7%, a difference of 5.9%), and Cheyenne (17.6%, a difference of 6.1%).
| Demographics | Rating | Rank | Male Poverty |
| Immigrants | Dominican Republic | 0.0 /100 | #330 | Tragic 16.2% |
| Ute | 0.0 /100 | #331 | Tragic 16.2% |
| Houma | 0.0 /100 | #332 | Tragic 16.7% |
| Natives/Alaskans | 0.0 /100 | #333 | Tragic 16.9% |
| Cheyenne | 0.0 /100 | #334 | Tragic 17.6% |
| Apache | 0.0 /100 | #335 | Tragic 17.7% |
| Pueblo | 0.0 /100 | #336 | Tragic 18.5% |
| Sioux | 0.0 /100 | #337 | Tragic 18.7% |
| Crow | 0.0 /100 | #338 | Tragic 19.1% |
| Yuman | 0.0 /100 | #339 | Tragic 19.5% |
| Immigrants | Yemen | 0.0 /100 | #340 | Tragic 20.1% |
| Lumbee | 0.0 /100 | #341 | Tragic 20.2% |
| Pima | 0.0 /100 | #342 | Tragic 20.4% |
| Yup'ik | 0.0 /100 | #343 | Tragic 20.4% |
| Hopi | 0.0 /100 | #344 | Tragic 20.8% |