South American vs Honduran Married-Couple Family Poverty
COMPARE
South American
Honduran
Married-Couple Family Poverty
Married-Couple Family Poverty Comparison
South Americans
Hondurans
5.6%
MARRIED-COUPLE FAMILY POVERTY
5.7/ 100
METRIC RATING
226th/ 347
METRIC RANK
7.2%
MARRIED-COUPLE FAMILY POVERTY
0.0/ 100
METRIC RATING
316th/ 347
METRIC RANK
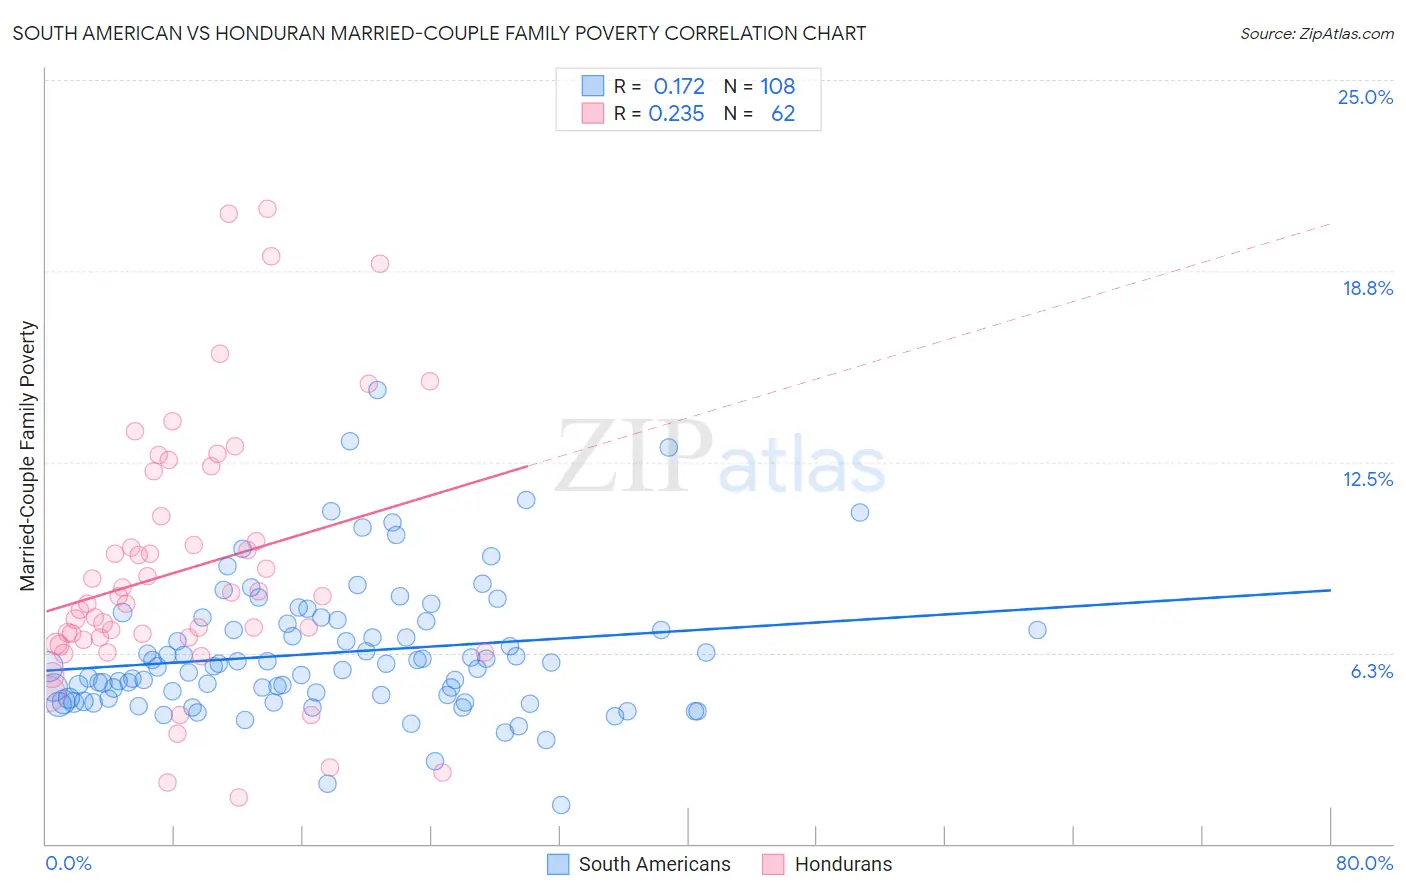
South American vs Honduran Married-Couple Family Poverty Correlation Chart
The statistical analysis conducted on geographies consisting of 487,269,778 people shows a poor positive correlation between the proportion of South Americans and poverty level among married-couple families in the United States with a correlation coefficient (R) of 0.172 and weighted average of 5.6%. Similarly, the statistical analysis conducted on geographies consisting of 355,775,439 people shows a weak positive correlation between the proportion of Hondurans and poverty level among married-couple families in the United States with a correlation coefficient (R) of 0.235 and weighted average of 7.2%, a difference of 26.8%.
Married-Couple Family Poverty Correlation Summary
| Measurement | South American | Honduran |
| Minimum | 1.3% | 1.5% |
| Maximum | 14.8% | 20.8% |
| Range | 13.6% | 19.3% |
| Mean | 6.2% | 9.0% |
| Median | 5.8% | 8.0% |
| Interquartile 25% (IQ1) | 4.8% | 6.7% |
| Interquartile 75% (IQ3) | 7.2% | 10.7% |
| Interquartile Range (IQR) | 2.5% | 4.0% |
| Standard Deviation (Sample) | 2.2% | 4.3% |
| Standard Deviation (Population) | 2.2% | 4.3% |
Similar Demographics by Married-Couple Family Poverty
Demographics Similar to South Americans by Married-Couple Family Poverty
In terms of married-couple family poverty, the demographic groups most similar to South Americans are Immigrants from Zaire (5.6%, a difference of 0.020%), Arab (5.7%, a difference of 0.15%), Immigrants from Cambodia (5.6%, a difference of 0.22%), Sudanese (5.6%, a difference of 0.37%), and Subsaharan African (5.7%, a difference of 0.40%).
| Demographics | Rating | Rank | Married-Couple Family Poverty |
| Japanese | 9.8 /100 | #219 | Tragic 5.6% |
| Colombians | 9.2 /100 | #220 | Tragic 5.6% |
| Panamanians | 9.2 /100 | #221 | Tragic 5.6% |
| Cajuns | 6.9 /100 | #222 | Tragic 5.6% |
| Immigrants | Fiji | 6.7 /100 | #223 | Tragic 5.6% |
| Sudanese | 6.4 /100 | #224 | Tragic 5.6% |
| Immigrants | Cambodia | 6.1 /100 | #225 | Tragic 5.6% |
| South Americans | 5.7 /100 | #226 | Tragic 5.6% |
| Immigrants | Zaire | 5.6 /100 | #227 | Tragic 5.6% |
| Arabs | 5.4 /100 | #228 | Tragic 5.7% |
| Sub-Saharan Africans | 4.9 /100 | #229 | Tragic 5.7% |
| Moroccans | 4.9 /100 | #230 | Tragic 5.7% |
| Immigrants | Iraq | 4.4 /100 | #231 | Tragic 5.7% |
| Immigrants | Laos | 4.4 /100 | #232 | Tragic 5.7% |
| Immigrants | Colombia | 3.7 /100 | #233 | Tragic 5.7% |
Demographics Similar to Hondurans by Married-Couple Family Poverty
In terms of married-couple family poverty, the demographic groups most similar to Hondurans are Inupiat (7.1%, a difference of 0.15%), Mexican (7.2%, a difference of 0.31%), British West Indian (7.1%, a difference of 0.39%), Immigrants from Guatemala (7.2%, a difference of 0.48%), and Immigrants from Latin America (7.2%, a difference of 0.65%).
| Demographics | Rating | Rank | Married-Couple Family Poverty |
| Hopi | 0.0 /100 | #309 | Tragic 7.1% |
| Immigrants | Nicaragua | 0.0 /100 | #310 | Tragic 7.1% |
| Immigrants | Dominica | 0.0 /100 | #311 | Tragic 7.1% |
| Immigrants | Armenia | 0.0 /100 | #312 | Tragic 7.1% |
| Immigrants | St. Vincent and the Grenadines | 0.0 /100 | #313 | Tragic 7.1% |
| British West Indians | 0.0 /100 | #314 | Tragic 7.1% |
| Inupiat | 0.0 /100 | #315 | Tragic 7.1% |
| Hondurans | 0.0 /100 | #316 | Tragic 7.2% |
| Mexicans | 0.0 /100 | #317 | Tragic 7.2% |
| Immigrants | Guatemala | 0.0 /100 | #318 | Tragic 7.2% |
| Immigrants | Latin America | 0.0 /100 | #319 | Tragic 7.2% |
| Immigrants | Grenada | 0.0 /100 | #320 | Tragic 7.3% |
| Immigrants | Caribbean | 0.0 /100 | #321 | Tragic 7.3% |
| Immigrants | Honduras | 0.0 /100 | #322 | Tragic 7.3% |
| Vietnamese | 0.0 /100 | #323 | Tragic 7.4% |