Swiss vs Canadian Single Male Poverty
COMPARE
Swiss
Canadian
Single Male Poverty
Single Male Poverty Comparison
Swiss
Canadians
13.8%
SINGLE MALE POVERTY
0.3/ 100
METRIC RATING
260th/ 347
METRIC RANK
13.3%
SINGLE MALE POVERTY
4.0/ 100
METRIC RATING
234th/ 347
METRIC RANK
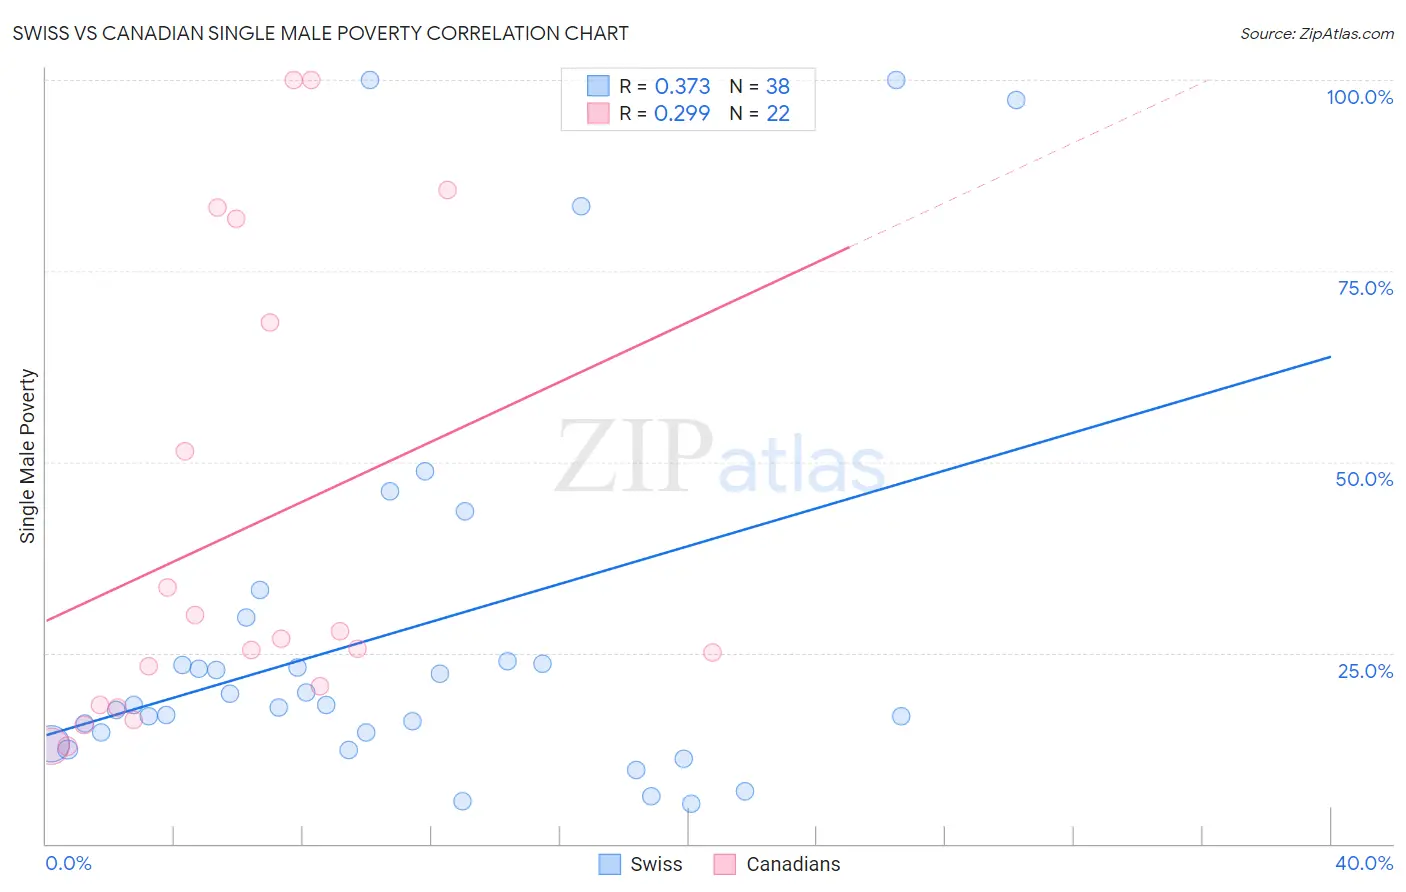
Swiss vs Canadian Single Male Poverty Correlation Chart
The statistical analysis conducted on geographies consisting of 396,994,211 people shows a mild positive correlation between the proportion of Swiss and poverty level among single males in the United States with a correlation coefficient (R) of 0.373 and weighted average of 13.8%. Similarly, the statistical analysis conducted on geographies consisting of 379,144,992 people shows a weak positive correlation between the proportion of Canadians and poverty level among single males in the United States with a correlation coefficient (R) of 0.299 and weighted average of 13.3%, a difference of 3.3%.
Single Male Poverty Correlation Summary
| Measurement | Swiss | Canadian |
| Minimum | 5.3% | 12.8% |
| Maximum | 100.0% | 100.0% |
| Range | 94.7% | 87.2% |
| Mean | 27.6% | 41.0% |
| Median | 18.2% | 26.2% |
| Interquartile 25% (IQ1) | 14.5% | 18.1% |
| Interquartile 75% (IQ3) | 23.8% | 68.3% |
| Interquartile Range (IQR) | 9.3% | 50.1% |
| Standard Deviation (Sample) | 25.6% | 30.2% |
| Standard Deviation (Population) | 25.3% | 29.5% |
Similar Demographics by Single Male Poverty
Demographics Similar to Swiss by Single Male Poverty
In terms of single male poverty, the demographic groups most similar to Swiss are Hungarian (13.8%, a difference of 0.050%), Guatemalan (13.8%, a difference of 0.070%), Immigrants from Guatemala (13.8%, a difference of 0.11%), Immigrants from Central America (13.8%, a difference of 0.18%), and Fijian (13.8%, a difference of 0.22%).
| Demographics | Rating | Rank | Single Male Poverty |
| German Russians | 0.8 /100 | #253 | Tragic 13.6% |
| Sub-Saharan Africans | 0.5 /100 | #254 | Tragic 13.7% |
| Spaniards | 0.4 /100 | #255 | Tragic 13.7% |
| Immigrants | Belize | 0.4 /100 | #256 | Tragic 13.7% |
| Immigrants | Central America | 0.3 /100 | #257 | Tragic 13.8% |
| Immigrants | Guatemala | 0.3 /100 | #258 | Tragic 13.8% |
| Guatemalans | 0.3 /100 | #259 | Tragic 13.8% |
| Swiss | 0.3 /100 | #260 | Tragic 13.8% |
| Hungarians | 0.3 /100 | #261 | Tragic 13.8% |
| Fijians | 0.3 /100 | #262 | Tragic 13.8% |
| Cape Verdeans | 0.2 /100 | #263 | Tragic 13.8% |
| West Indians | 0.2 /100 | #264 | Tragic 13.8% |
| Immigrants | Congo | 0.2 /100 | #265 | Tragic 13.9% |
| Immigrants | Cabo Verde | 0.1 /100 | #266 | Tragic 13.9% |
| Germans | 0.1 /100 | #267 | Tragic 13.9% |
Demographics Similar to Canadians by Single Male Poverty
In terms of single male poverty, the demographic groups most similar to Canadians are British (13.3%, a difference of 0.0%), Bangladeshi (13.3%, a difference of 0.10%), Luxembourger (13.4%, a difference of 0.15%), British West Indian (13.4%, a difference of 0.21%), and Immigrants from Caribbean (13.3%, a difference of 0.29%).
| Demographics | Rating | Rank | Single Male Poverty |
| Haitians | 7.0 /100 | #227 | Tragic 13.2% |
| Lebanese | 6.6 /100 | #228 | Tragic 13.2% |
| Europeans | 6.2 /100 | #229 | Tragic 13.3% |
| Ghanaians | 6.1 /100 | #230 | Tragic 13.3% |
| Slavs | 5.3 /100 | #231 | Tragic 13.3% |
| Immigrants | Caribbean | 5.0 /100 | #232 | Tragic 13.3% |
| British | 4.0 /100 | #233 | Tragic 13.3% |
| Canadians | 4.0 /100 | #234 | Tragic 13.3% |
| Bangladeshis | 3.7 /100 | #235 | Tragic 13.3% |
| Luxembourgers | 3.6 /100 | #236 | Tragic 13.4% |
| British West Indians | 3.4 /100 | #237 | Tragic 13.4% |
| Immigrants | Ghana | 3.2 /100 | #238 | Tragic 13.4% |
| Czechoslovakians | 3.0 /100 | #239 | Tragic 13.4% |
| Belizeans | 2.3 /100 | #240 | Tragic 13.4% |
| Immigrants | Germany | 2.1 /100 | #241 | Tragic 13.4% |