Swiss vs Immigrants from Eastern Europe Single Father Poverty
COMPARE
Swiss
Immigrants from Eastern Europe
Single Father Poverty
Single Father Poverty Comparison
Swiss
Immigrants from Eastern Europe
17.3%
SINGLE FATHER POVERTY
0.5/ 100
METRIC RATING
261st/ 347
METRIC RANK
15.8%
SINGLE FATHER POVERTY
92.5/ 100
METRIC RATING
118th/ 347
METRIC RANK
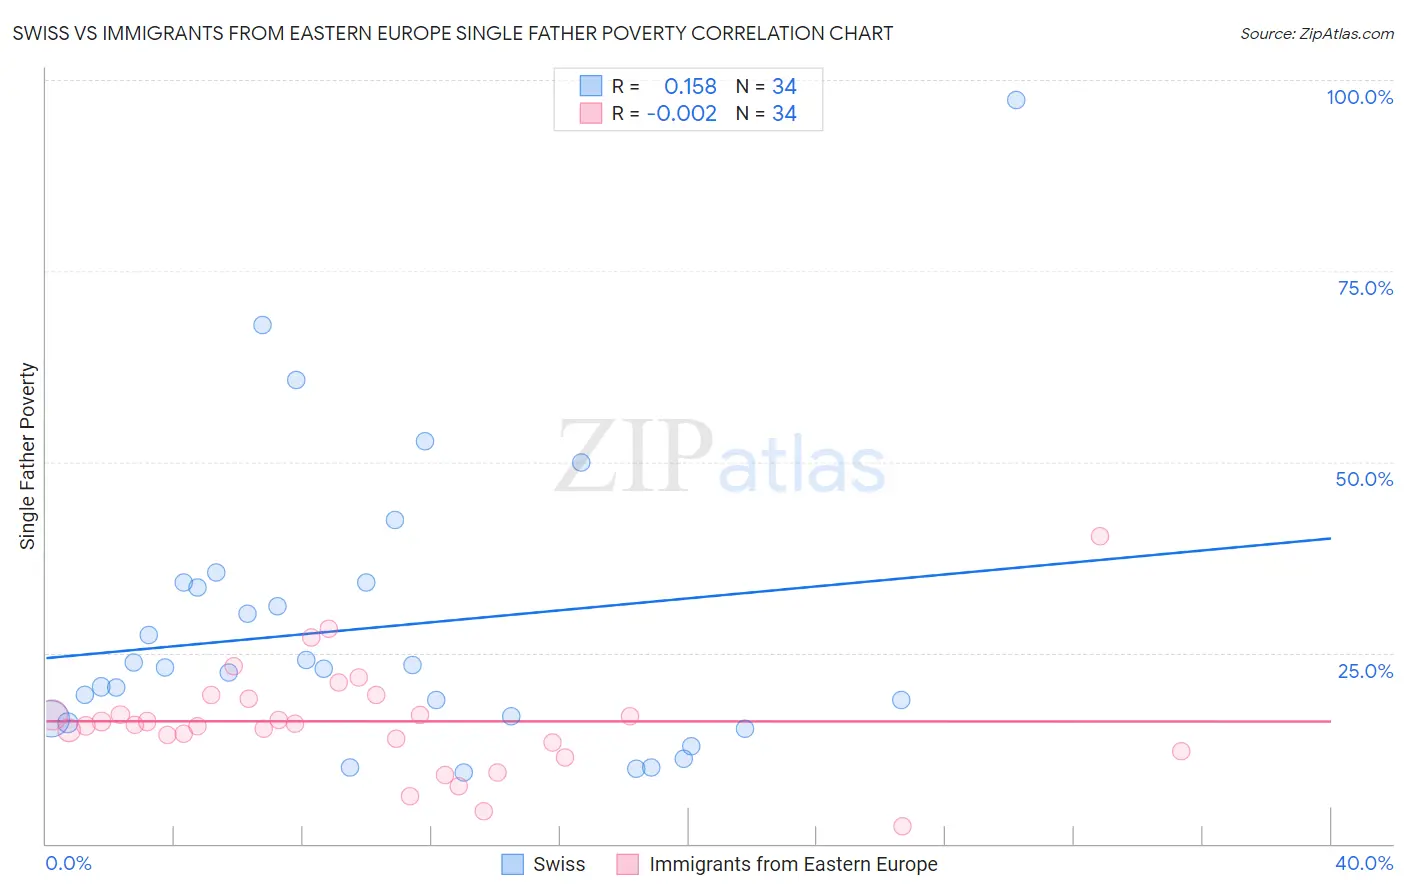
Swiss vs Immigrants from Eastern Europe Single Father Poverty Correlation Chart
The statistical analysis conducted on geographies consisting of 347,944,226 people shows a poor positive correlation between the proportion of Swiss and poverty level among single fathers in the United States with a correlation coefficient (R) of 0.158 and weighted average of 17.3%. Similarly, the statistical analysis conducted on geographies consisting of 357,994,148 people shows no correlation between the proportion of Immigrants from Eastern Europe and poverty level among single fathers in the United States with a correlation coefficient (R) of -0.002 and weighted average of 15.8%, a difference of 8.9%.
Single Father Poverty Correlation Summary
| Measurement | Swiss | Immigrants from Eastern Europe |
| Minimum | 9.4% | 2.4% |
| Maximum | 97.4% | 40.3% |
| Range | 88.1% | 38.0% |
| Mean | 28.3% | 16.0% |
| Median | 23.0% | 15.6% |
| Interquartile 25% (IQ1) | 16.3% | 13.3% |
| Interquartile 75% (IQ3) | 34.2% | 18.9% |
| Interquartile Range (IQR) | 17.9% | 5.6% |
| Standard Deviation (Sample) | 19.0% | 7.1% |
| Standard Deviation (Population) | 18.7% | 7.0% |
Similar Demographics by Single Father Poverty
Demographics Similar to Swiss by Single Father Poverty
In terms of single father poverty, the demographic groups most similar to Swiss are Immigrants from Zaire (17.3%, a difference of 0.13%), Lithuanian (17.3%, a difference of 0.14%), Spaniard (17.2%, a difference of 0.22%), Slovene (17.3%, a difference of 0.34%), and Polish (17.3%, a difference of 0.35%).
| Demographics | Rating | Rank | Single Father Poverty |
| Immigrants | Honduras | 0.9 /100 | #254 | Tragic 17.1% |
| Sierra Leoneans | 0.8 /100 | #255 | Tragic 17.2% |
| Immigrants | Haiti | 0.8 /100 | #256 | Tragic 17.2% |
| Immigrants | Albania | 0.7 /100 | #257 | Tragic 17.2% |
| Albanians | 0.7 /100 | #258 | Tragic 17.2% |
| Immigrants | Jamaica | 0.7 /100 | #259 | Tragic 17.2% |
| Spaniards | 0.6 /100 | #260 | Tragic 17.2% |
| Swiss | 0.5 /100 | #261 | Tragic 17.3% |
| Immigrants | Zaire | 0.4 /100 | #262 | Tragic 17.3% |
| Lithuanians | 0.4 /100 | #263 | Tragic 17.3% |
| Slovenes | 0.3 /100 | #264 | Tragic 17.3% |
| Poles | 0.3 /100 | #265 | Tragic 17.3% |
| Jamaicans | 0.3 /100 | #266 | Tragic 17.3% |
| Haitians | 0.3 /100 | #267 | Tragic 17.3% |
| Immigrants | Caribbean | 0.3 /100 | #268 | Tragic 17.4% |
Demographics Similar to Immigrants from Eastern Europe by Single Father Poverty
In terms of single father poverty, the demographic groups most similar to Immigrants from Eastern Europe are Immigrants from Belarus (15.8%, a difference of 0.010%), Immigrants from Colombia (15.8%, a difference of 0.020%), Immigrants from Argentina (15.8%, a difference of 0.040%), Uruguayan (15.9%, a difference of 0.070%), and Immigrants (15.9%, a difference of 0.090%).
| Demographics | Rating | Rank | Single Father Poverty |
| Bulgarians | 94.8 /100 | #111 | Exceptional 15.8% |
| Immigrants | Latvia | 94.7 /100 | #112 | Exceptional 15.8% |
| Danes | 94.5 /100 | #113 | Exceptional 15.8% |
| Argentineans | 94.4 /100 | #114 | Exceptional 15.8% |
| Immigrants | Thailand | 93.6 /100 | #115 | Exceptional 15.8% |
| Immigrants | Argentina | 92.8 /100 | #116 | Exceptional 15.8% |
| Immigrants | Colombia | 92.6 /100 | #117 | Exceptional 15.8% |
| Immigrants | Eastern Europe | 92.5 /100 | #118 | Exceptional 15.8% |
| Immigrants | Belarus | 92.4 /100 | #119 | Exceptional 15.8% |
| Uruguayans | 92.1 /100 | #120 | Exceptional 15.9% |
| Immigrants | Immigrants | 91.9 /100 | #121 | Exceptional 15.9% |
| Sudanese | 91.6 /100 | #122 | Exceptional 15.9% |
| Palestinians | 91.3 /100 | #123 | Exceptional 15.9% |
| Immigrants | Panama | 91.3 /100 | #124 | Exceptional 15.9% |
| Iraqis | 91.2 /100 | #125 | Exceptional 15.9% |