Taiwanese vs Alsatian Single Father Poverty
COMPARE
Taiwanese
Alsatian
Single Father Poverty
Single Father Poverty Comparison
Taiwanese
Alsatians
14.3%
SINGLE FATHER POVERTY
100.0/ 100
METRIC RATING
22nd/ 347
METRIC RANK
17.8%
SINGLE FATHER POVERTY
0.0/ 100
METRIC RATING
283rd/ 347
METRIC RANK
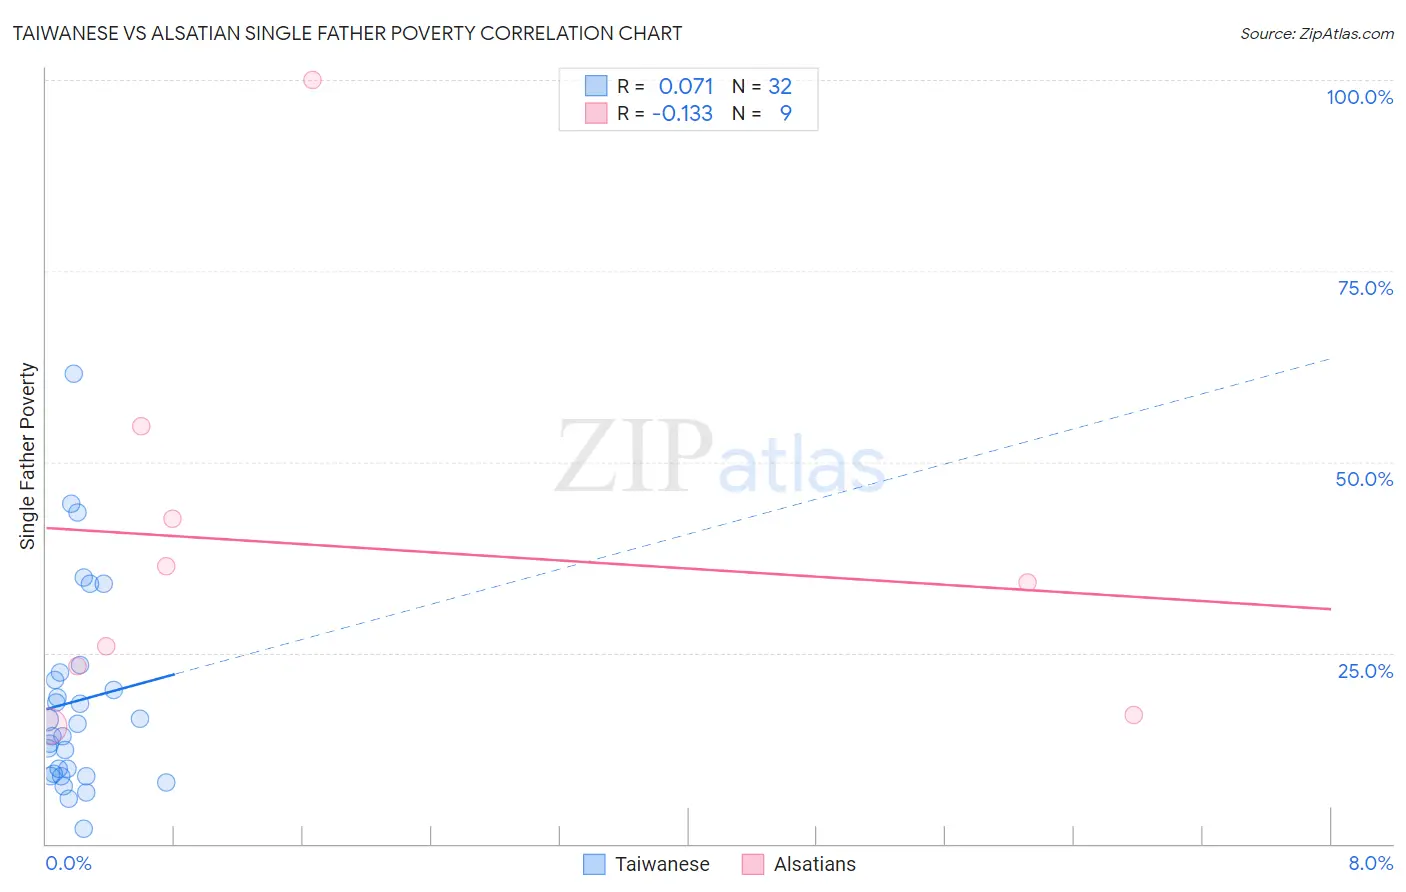
Taiwanese vs Alsatian Single Father Poverty Correlation Chart
The statistical analysis conducted on geographies consisting of 30,651,469 people shows a slight positive correlation between the proportion of Taiwanese and poverty level among single fathers in the United States with a correlation coefficient (R) of 0.071 and weighted average of 14.3%. Similarly, the statistical analysis conducted on geographies consisting of 73,758,627 people shows a poor negative correlation between the proportion of Alsatians and poverty level among single fathers in the United States with a correlation coefficient (R) of -0.133 and weighted average of 17.8%, a difference of 24.4%.
Single Father Poverty Correlation Summary
| Measurement | Taiwanese | Alsatian |
| Minimum | 2.0% | 15.4% |
| Maximum | 61.5% | 100.0% |
| Range | 59.5% | 84.6% |
| Mean | 18.6% | 38.8% |
| Median | 14.9% | 34.2% |
| Interquartile 25% (IQ1) | 9.0% | 20.1% |
| Interquartile 75% (IQ3) | 21.9% | 48.6% |
| Interquartile Range (IQR) | 12.9% | 28.5% |
| Standard Deviation (Sample) | 13.2% | 26.2% |
| Standard Deviation (Population) | 13.0% | 24.7% |
Similar Demographics by Single Father Poverty
Demographics Similar to Taiwanese by Single Father Poverty
In terms of single father poverty, the demographic groups most similar to Taiwanese are Immigrants from Egypt (14.4%, a difference of 0.21%), Immigrants from South Eastern Asia (14.4%, a difference of 0.21%), Iranian (14.4%, a difference of 0.25%), Immigrants from Afghanistan (14.3%, a difference of 0.33%), and Immigrants from Singapore (14.3%, a difference of 0.43%).
| Demographics | Rating | Rank | Single Father Poverty |
| Sri Lankans | 100.0 /100 | #15 | Exceptional 14.2% |
| Immigrants | Iran | 100.0 /100 | #16 | Exceptional 14.2% |
| Immigrants | Hong Kong | 100.0 /100 | #17 | Exceptional 14.2% |
| Soviet Union | 100.0 /100 | #18 | Exceptional 14.3% |
| Immigrants | Iraq | 100.0 /100 | #19 | Exceptional 14.3% |
| Immigrants | Singapore | 100.0 /100 | #20 | Exceptional 14.3% |
| Immigrants | Afghanistan | 100.0 /100 | #21 | Exceptional 14.3% |
| Taiwanese | 100.0 /100 | #22 | Exceptional 14.3% |
| Immigrants | Egypt | 100.0 /100 | #23 | Exceptional 14.4% |
| Immigrants | South Eastern Asia | 100.0 /100 | #24 | Exceptional 14.4% |
| Iranians | 100.0 /100 | #25 | Exceptional 14.4% |
| Spanish American Indians | 100.0 /100 | #26 | Exceptional 14.4% |
| Nepalese | 100.0 /100 | #27 | Exceptional 14.4% |
| Immigrants | South Central Asia | 100.0 /100 | #28 | Exceptional 14.5% |
| Somalis | 100.0 /100 | #29 | Exceptional 14.5% |
Demographics Similar to Alsatians by Single Father Poverty
In terms of single father poverty, the demographic groups most similar to Alsatians are Welsh (17.8%, a difference of 0.020%), English (17.8%, a difference of 0.10%), Dutch (17.8%, a difference of 0.10%), Immigrants from Lebanon (17.9%, a difference of 0.38%), and Scottish (17.7%, a difference of 0.42%).
| Demographics | Rating | Rank | Single Father Poverty |
| German Russians | 0.0 /100 | #276 | Tragic 17.7% |
| Lebanese | 0.0 /100 | #277 | Tragic 17.7% |
| Germans | 0.0 /100 | #278 | Tragic 17.7% |
| Iroquois | 0.0 /100 | #279 | Tragic 17.7% |
| Scottish | 0.0 /100 | #280 | Tragic 17.7% |
| English | 0.0 /100 | #281 | Tragic 17.8% |
| Dutch | 0.0 /100 | #282 | Tragic 17.8% |
| Alsatians | 0.0 /100 | #283 | Tragic 17.8% |
| Welsh | 0.0 /100 | #284 | Tragic 17.8% |
| Immigrants | Lebanon | 0.0 /100 | #285 | Tragic 17.9% |
| Immigrants | North Macedonia | 0.0 /100 | #286 | Tragic 17.9% |
| Carpatho Rusyns | 0.0 /100 | #287 | Tragic 18.0% |
| Bahamians | 0.0 /100 | #288 | Tragic 18.0% |
| Irish | 0.0 /100 | #289 | Tragic 18.0% |
| West Indians | 0.0 /100 | #290 | Tragic 18.0% |