Taiwanese vs Nonimmigrants Male Poverty
COMPARE
Taiwanese
Nonimmigrants
Male Poverty
Male Poverty Comparison
Taiwanese
Nonimmigrants
11.0%
MALE POVERTY
62.7/ 100
METRIC RATING
159th/ 347
METRIC RANK
12.1%
MALE POVERTY
3.1/ 100
METRIC RATING
213th/ 347
METRIC RANK
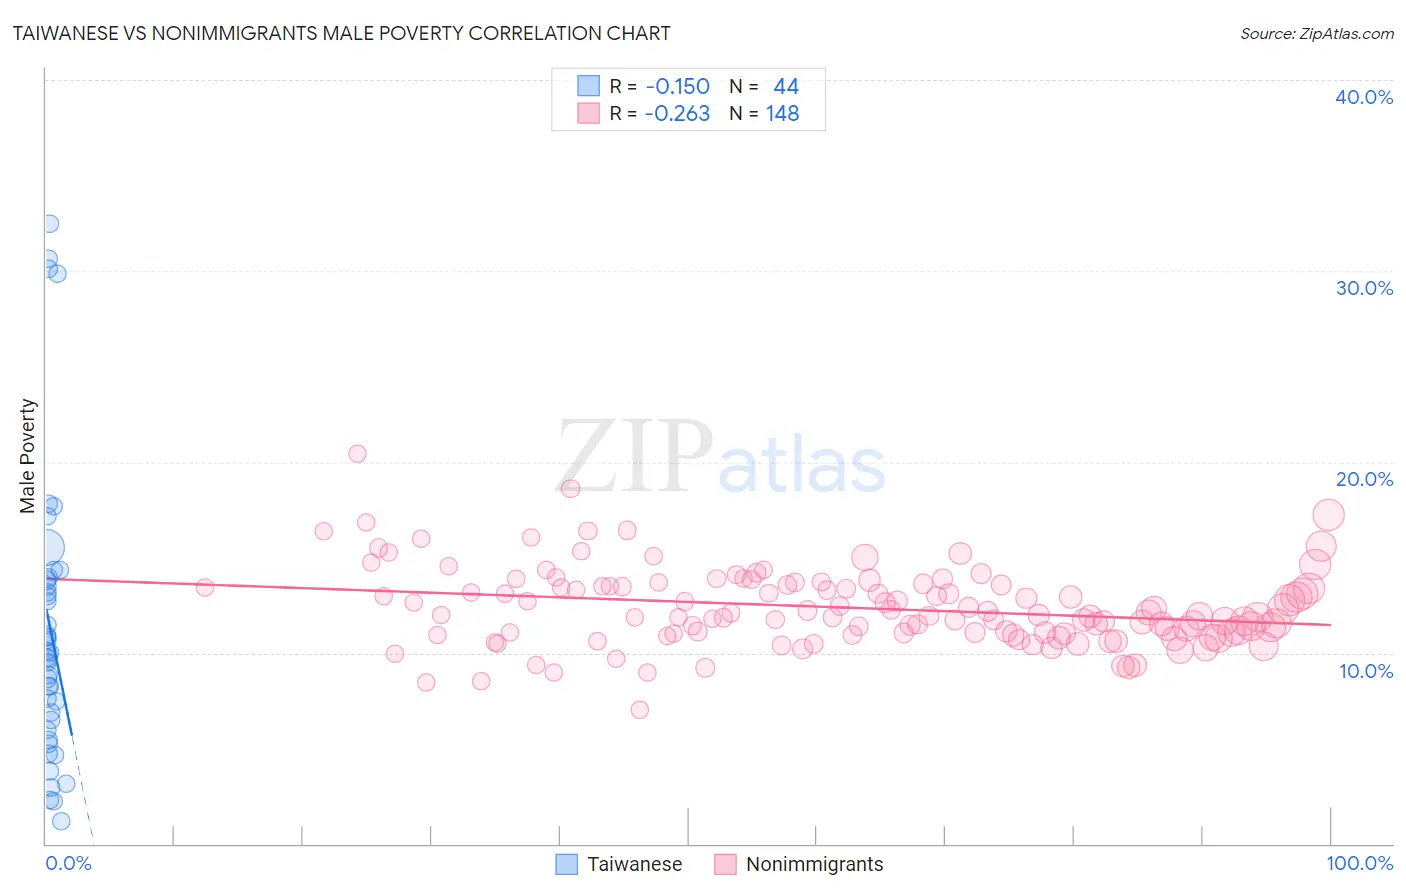
Taiwanese vs Nonimmigrants Male Poverty Correlation Chart
The statistical analysis conducted on geographies consisting of 31,715,286 people shows a poor negative correlation between the proportion of Taiwanese and poverty level among males in the United States with a correlation coefficient (R) of -0.150 and weighted average of 11.0%. Similarly, the statistical analysis conducted on geographies consisting of 582,696,583 people shows a weak negative correlation between the proportion of Nonimmigrants and poverty level among males in the United States with a correlation coefficient (R) of -0.263 and weighted average of 12.1%, a difference of 9.8%.
Male Poverty Correlation Summary
| Measurement | Taiwanese | Nonimmigrants |
| Minimum | 1.2% | 7.0% |
| Maximum | 32.5% | 20.4% |
| Range | 31.3% | 13.4% |
| Mean | 11.3% | 12.4% |
| Median | 9.9% | 12.0% |
| Interquartile 25% (IQ1) | 6.2% | 11.0% |
| Interquartile 75% (IQ3) | 13.9% | 13.5% |
| Interquartile Range (IQR) | 7.6% | 2.5% |
| Standard Deviation (Sample) | 7.6% | 2.0% |
| Standard Deviation (Population) | 7.5% | 2.0% |
Similar Demographics by Male Poverty
Demographics Similar to Taiwanese by Male Poverty
In terms of male poverty, the demographic groups most similar to Taiwanese are Colombian (11.0%, a difference of 0.030%), Scotch-Irish (11.0%, a difference of 0.10%), Costa Rican (11.0%, a difference of 0.12%), Immigrants from Kazakhstan (11.0%, a difference of 0.22%), and Immigrants from Malaysia (11.0%, a difference of 0.22%).
| Demographics | Rating | Rank | Male Poverty |
| Immigrants | Nepal | 67.3 /100 | #152 | Good 11.0% |
| Immigrants | Bosnia and Herzegovina | 65.2 /100 | #153 | Good 11.0% |
| Immigrants | Kazakhstan | 64.8 /100 | #154 | Good 11.0% |
| Immigrants | Malaysia | 64.7 /100 | #155 | Good 11.0% |
| Costa Ricans | 63.9 /100 | #156 | Good 11.0% |
| Scotch-Irish | 63.7 /100 | #157 | Good 11.0% |
| Colombians | 63.0 /100 | #158 | Good 11.0% |
| Taiwanese | 62.7 /100 | #159 | Good 11.0% |
| Soviet Union | 60.3 /100 | #160 | Good 11.1% |
| Immigrants | Northern Africa | 59.7 /100 | #161 | Average 11.1% |
| Immigrants | Chile | 57.4 /100 | #162 | Average 11.1% |
| Whites/Caucasians | 56.7 /100 | #163 | Average 11.1% |
| Ethiopians | 56.7 /100 | #164 | Average 11.1% |
| Immigrants | Spain | 55.5 /100 | #165 | Average 11.1% |
| Immigrants | Albania | 55.3 /100 | #166 | Average 11.1% |
Demographics Similar to Nonimmigrants by Male Poverty
In terms of male poverty, the demographic groups most similar to Nonimmigrants are American (12.1%, a difference of 0.040%), Japanese (12.2%, a difference of 0.32%), Immigrants from Uzbekistan (12.2%, a difference of 0.43%), Immigrants from Cambodia (12.2%, a difference of 0.51%), and Immigrants from Thailand (12.2%, a difference of 0.52%).
| Demographics | Rating | Rank | Male Poverty |
| Immigrants | Eastern Africa | 5.4 /100 | #206 | Tragic 12.0% |
| Malaysians | 5.2 /100 | #207 | Tragic 12.0% |
| Immigrants | Immigrants | 4.5 /100 | #208 | Tragic 12.0% |
| Immigrants | Azores | 4.3 /100 | #209 | Tragic 12.0% |
| Moroccans | 4.2 /100 | #210 | Tragic 12.0% |
| Immigrants | Panama | 4.0 /100 | #211 | Tragic 12.1% |
| Americans | 3.2 /100 | #212 | Tragic 12.1% |
| Immigrants | Nonimmigrants | 3.1 /100 | #213 | Tragic 12.1% |
| Japanese | 2.7 /100 | #214 | Tragic 12.2% |
| Immigrants | Uzbekistan | 2.6 /100 | #215 | Tragic 12.2% |
| Immigrants | Cambodia | 2.5 /100 | #216 | Tragic 12.2% |
| Immigrants | Thailand | 2.5 /100 | #217 | Tragic 12.2% |
| German Russians | 2.5 /100 | #218 | Tragic 12.2% |
| Bermudans | 2.4 /100 | #219 | Tragic 12.2% |
| Immigrants | Eritrea | 2.4 /100 | #220 | Tragic 12.2% |