Tlingit-Haida vs Guyanese Male Poverty
COMPARE
Tlingit-Haida
Guyanese
Male Poverty
Male Poverty Comparison
Tlingit-Haida
Guyanese
10.9%
MALE POVERTY
76.1/ 100
METRIC RATING
140th/ 347
METRIC RANK
13.3%
MALE POVERTY
0.0/ 100
METRIC RATING
269th/ 347
METRIC RANK
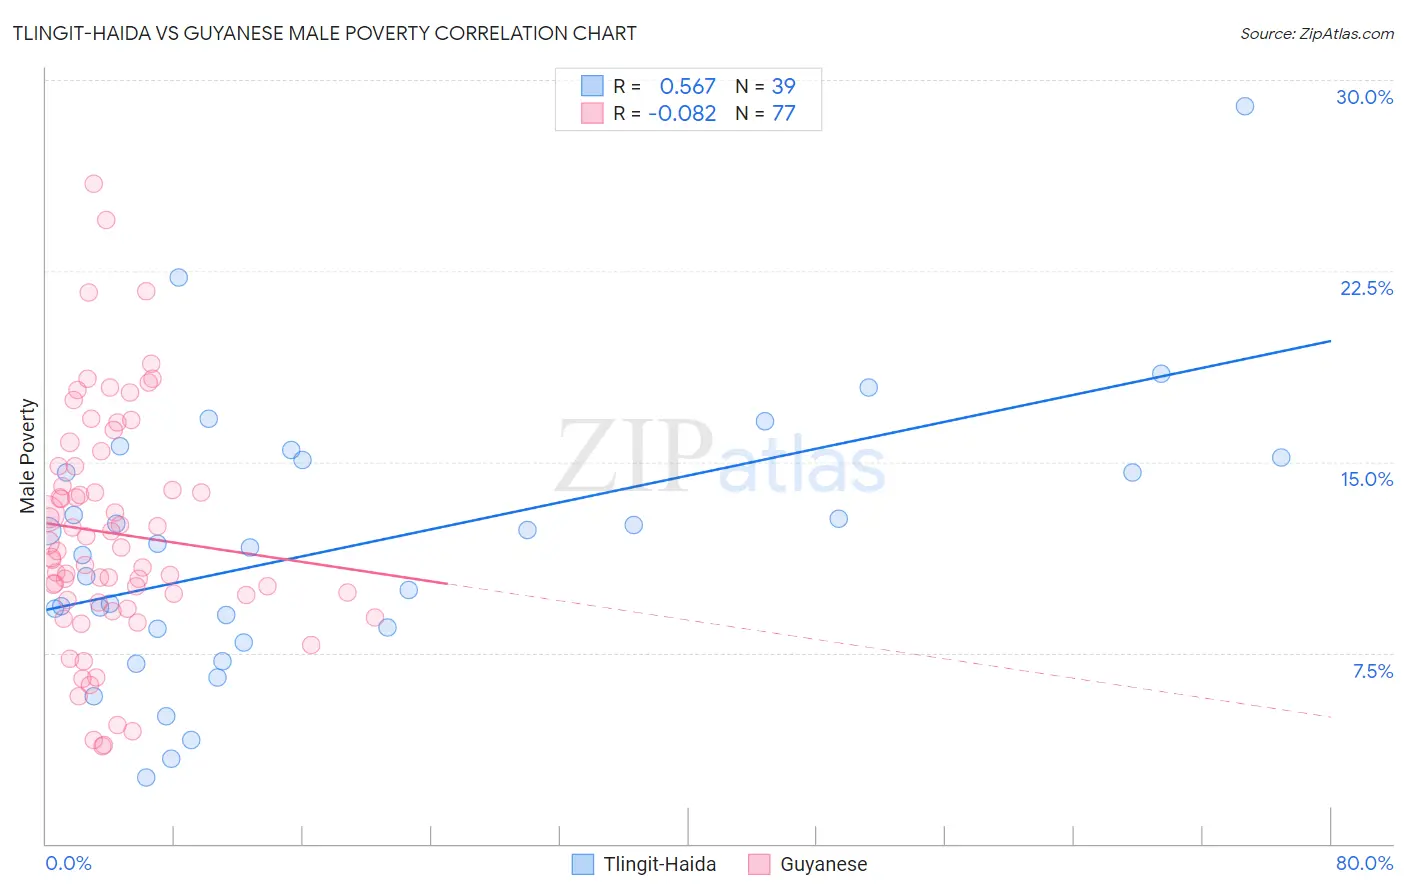
Tlingit-Haida vs Guyanese Male Poverty Correlation Chart
The statistical analysis conducted on geographies consisting of 60,854,564 people shows a substantial positive correlation between the proportion of Tlingit-Haida and poverty level among males in the United States with a correlation coefficient (R) of 0.567 and weighted average of 10.9%. Similarly, the statistical analysis conducted on geographies consisting of 176,774,769 people shows a slight negative correlation between the proportion of Guyanese and poverty level among males in the United States with a correlation coefficient (R) of -0.082 and weighted average of 13.3%, a difference of 22.2%.
Male Poverty Correlation Summary
| Measurement | Tlingit-Haida | Guyanese |
| Minimum | 2.6% | 3.8% |
| Maximum | 28.9% | 25.9% |
| Range | 26.3% | 22.1% |
| Mean | 11.7% | 12.2% |
| Median | 11.6% | 11.5% |
| Interquartile 25% (IQ1) | 8.5% | 9.5% |
| Interquartile 75% (IQ3) | 15.1% | 14.8% |
| Interquartile Range (IQR) | 6.6% | 5.3% |
| Standard Deviation (Sample) | 5.2% | 4.6% |
| Standard Deviation (Population) | 5.2% | 4.6% |
Similar Demographics by Male Poverty
Demographics Similar to Tlingit-Haida by Male Poverty
In terms of male poverty, the demographic groups most similar to Tlingit-Haida are Immigrants from France (10.9%, a difference of 0.030%), Immigrants from Jordan (10.8%, a difference of 0.19%), Basque (10.9%, a difference of 0.20%), Yugoslavian (10.8%, a difference of 0.31%), and Immigrants from Switzerland (10.8%, a difference of 0.46%).
| Demographics | Rating | Rank | Male Poverty |
| Pakistanis | 83.0 /100 | #133 | Excellent 10.8% |
| New Zealanders | 82.9 /100 | #134 | Excellent 10.8% |
| Brazilians | 82.7 /100 | #135 | Excellent 10.8% |
| Immigrants | Israel | 80.9 /100 | #136 | Excellent 10.8% |
| Immigrants | Switzerland | 79.2 /100 | #137 | Good 10.8% |
| Yugoslavians | 78.2 /100 | #138 | Good 10.8% |
| Immigrants | Jordan | 77.5 /100 | #139 | Good 10.8% |
| Tlingit-Haida | 76.1 /100 | #140 | Good 10.9% |
| Immigrants | France | 75.8 /100 | #141 | Good 10.9% |
| Basques | 74.6 /100 | #142 | Good 10.9% |
| Afghans | 71.9 /100 | #143 | Good 10.9% |
| Samoans | 71.8 /100 | #144 | Good 10.9% |
| Immigrants | Germany | 71.6 /100 | #145 | Good 10.9% |
| Syrians | 71.4 /100 | #146 | Good 10.9% |
| Icelanders | 68.5 /100 | #147 | Good 11.0% |
Demographics Similar to Guyanese by Male Poverty
In terms of male poverty, the demographic groups most similar to Guyanese are Subsaharan African (13.3%, a difference of 0.22%), Immigrants from Jamaica (13.3%, a difference of 0.25%), Immigrants from Guyana (13.2%, a difference of 0.36%), Cree (13.3%, a difference of 0.47%), and Spanish American (13.4%, a difference of 0.50%).
| Demographics | Rating | Rank | Male Poverty |
| Spanish American Indians | 0.1 /100 | #262 | Tragic 13.1% |
| Central Americans | 0.1 /100 | #263 | Tragic 13.2% |
| Iroquois | 0.1 /100 | #264 | Tragic 13.2% |
| Jamaicans | 0.1 /100 | #265 | Tragic 13.2% |
| Immigrants | Guyana | 0.1 /100 | #266 | Tragic 13.2% |
| Immigrants | Jamaica | 0.1 /100 | #267 | Tragic 13.3% |
| Sub-Saharan Africans | 0.1 /100 | #268 | Tragic 13.3% |
| Guyanese | 0.0 /100 | #269 | Tragic 13.3% |
| Cree | 0.0 /100 | #270 | Tragic 13.3% |
| Spanish Americans | 0.0 /100 | #271 | Tragic 13.4% |
| Immigrants | Bahamas | 0.0 /100 | #272 | Tragic 13.5% |
| Chickasaw | 0.0 /100 | #273 | Tragic 13.5% |
| Immigrants | West Indies | 0.0 /100 | #274 | Tragic 13.5% |
| Barbadians | 0.0 /100 | #275 | Tragic 13.6% |
| Immigrants | Latin America | 0.0 /100 | #276 | Tragic 13.6% |