Tsimshian vs French Single Female Poverty
COMPARE
Tsimshian
French
Single Female Poverty
Single Female Poverty Comparison
Tsimshian
French
19.1%
SINGLE FEMALE POVERTY
99.7/ 100
METRIC RATING
53rd/ 347
METRIC RANK
22.2%
SINGLE FEMALE POVERTY
2.3/ 100
METRIC RATING
240th/ 347
METRIC RANK
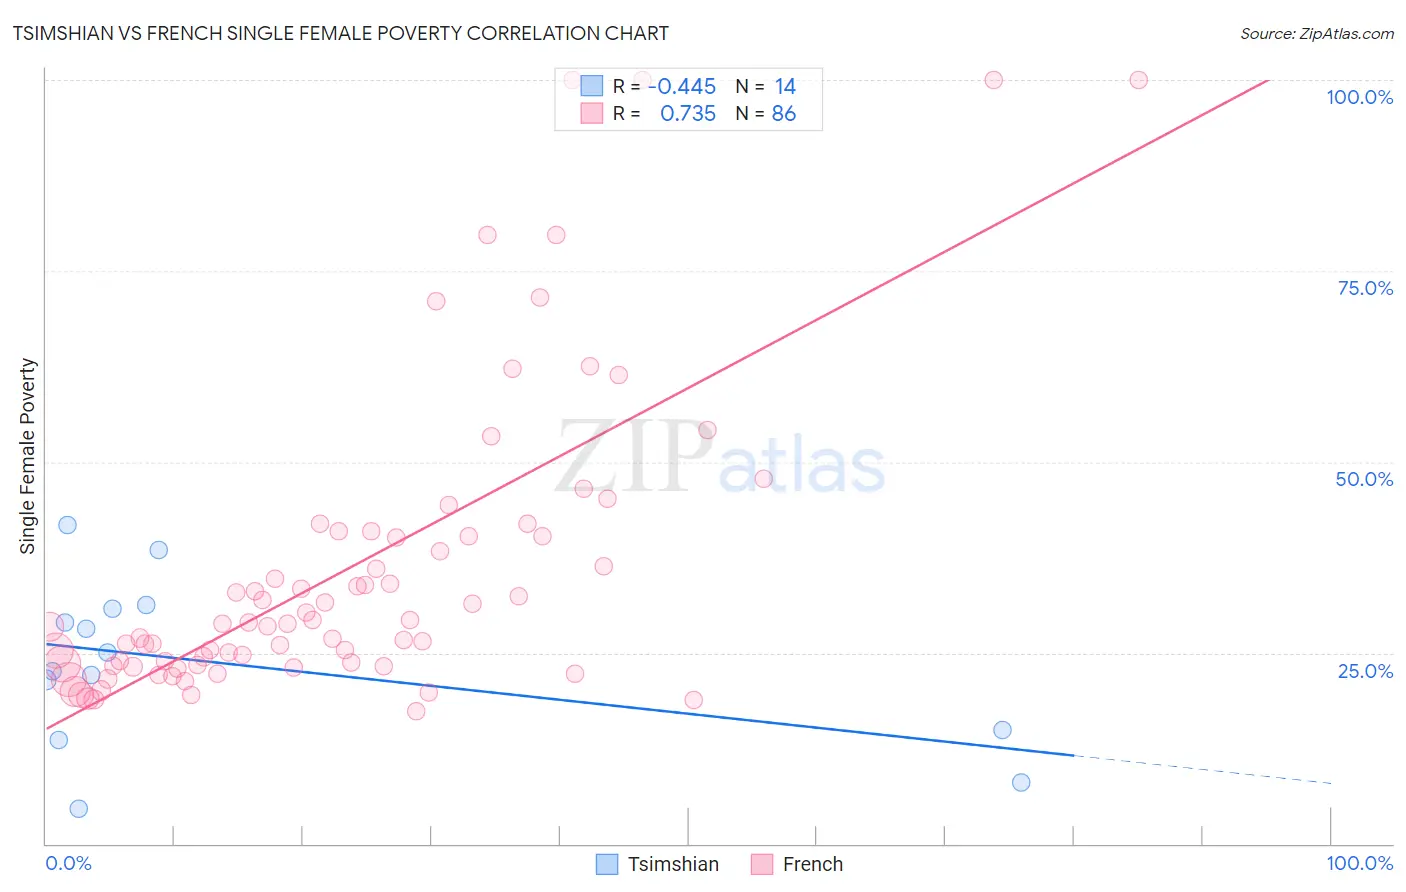
Tsimshian vs French Single Female Poverty Correlation Chart
The statistical analysis conducted on geographies consisting of 15,615,751 people shows a moderate negative correlation between the proportion of Tsimshian and poverty level among single females in the United States with a correlation coefficient (R) of -0.445 and weighted average of 19.1%. Similarly, the statistical analysis conducted on geographies consisting of 551,878,026 people shows a strong positive correlation between the proportion of French and poverty level among single females in the United States with a correlation coefficient (R) of 0.735 and weighted average of 22.2%, a difference of 16.4%.
Single Female Poverty Correlation Summary
| Measurement | Tsimshian | French |
| Minimum | 4.5% | 17.3% |
| Maximum | 41.7% | 100.0% |
| Range | 37.1% | 82.7% |
| Mean | 23.7% | 36.0% |
| Median | 23.8% | 28.8% |
| Interquartile 25% (IQ1) | 14.8% | 23.4% |
| Interquartile 75% (IQ3) | 30.8% | 40.3% |
| Interquartile Range (IQR) | 16.0% | 17.0% |
| Standard Deviation (Sample) | 10.7% | 19.8% |
| Standard Deviation (Population) | 10.4% | 19.7% |
Similar Demographics by Single Female Poverty
Demographics Similar to Tsimshian by Single Female Poverty
In terms of single female poverty, the demographic groups most similar to Tsimshian are Argentinean (19.1%, a difference of 0.010%), Immigrants from Vietnam (19.1%, a difference of 0.050%), Immigrants from Fiji (19.1%, a difference of 0.10%), Eastern European (19.1%, a difference of 0.16%), and Egyptian (19.1%, a difference of 0.21%).
| Demographics | Rating | Rank | Single Female Poverty |
| Macedonians | 99.8 /100 | #46 | Exceptional 18.9% |
| Latvians | 99.8 /100 | #47 | Exceptional 19.0% |
| Immigrants | Argentina | 99.8 /100 | #48 | Exceptional 19.0% |
| Immigrants | Czechoslovakia | 99.8 /100 | #49 | Exceptional 19.0% |
| Immigrants | Eastern Europe | 99.8 /100 | #50 | Exceptional 19.0% |
| Immigrants | Italy | 99.8 /100 | #51 | Exceptional 19.0% |
| Egyptians | 99.7 /100 | #52 | Exceptional 19.1% |
| Tsimshian | 99.7 /100 | #53 | Exceptional 19.1% |
| Argentineans | 99.7 /100 | #54 | Exceptional 19.1% |
| Immigrants | Vietnam | 99.7 /100 | #55 | Exceptional 19.1% |
| Immigrants | Fiji | 99.7 /100 | #56 | Exceptional 19.1% |
| Eastern Europeans | 99.7 /100 | #57 | Exceptional 19.1% |
| Immigrants | Bulgaria | 99.7 /100 | #58 | Exceptional 19.1% |
| Sri Lankans | 99.6 /100 | #59 | Exceptional 19.2% |
| Russians | 99.6 /100 | #60 | Exceptional 19.2% |
Demographics Similar to French by Single Female Poverty
In terms of single female poverty, the demographic groups most similar to French are Cape Verdean (22.3%, a difference of 0.14%), Bermudan (22.3%, a difference of 0.21%), Malaysian (22.2%, a difference of 0.26%), French Canadian (22.2%, a difference of 0.27%), and West Indian (22.3%, a difference of 0.30%).
| Demographics | Rating | Rank | Single Female Poverty |
| Spaniards | 4.7 /100 | #233 | Tragic 22.0% |
| Spanish | 4.7 /100 | #234 | Tragic 22.0% |
| Dutch | 4.6 /100 | #235 | Tragic 22.0% |
| Immigrants | Ecuador | 4.2 /100 | #236 | Tragic 22.0% |
| Vietnamese | 4.0 /100 | #237 | Tragic 22.0% |
| French Canadians | 2.8 /100 | #238 | Tragic 22.2% |
| Malaysians | 2.8 /100 | #239 | Tragic 22.2% |
| French | 2.3 /100 | #240 | Tragic 22.2% |
| Cape Verdeans | 2.1 /100 | #241 | Tragic 22.3% |
| Bermudans | 2.0 /100 | #242 | Tragic 22.3% |
| West Indians | 1.9 /100 | #243 | Tragic 22.3% |
| Immigrants | Middle Africa | 1.9 /100 | #244 | Tragic 22.3% |
| Immigrants | Bangladesh | 1.8 /100 | #245 | Tragic 22.3% |
| Liberians | 1.4 /100 | #246 | Tragic 22.4% |
| Immigrants | El Salvador | 1.4 /100 | #247 | Tragic 22.4% |