Welsh vs Belizean Seniors Poverty Over the Age of 75
COMPARE
Welsh
Belizean
Seniors Poverty Over the Age of 75
Seniors Poverty Over the Age of 75 Comparison
Welsh
Belizeans
10.5%
SENIORS POVERTY OVER THE AGE OF 75
99.9/ 100
METRIC RATING
18th/ 347
METRIC RANK
14.8%
SENIORS POVERTY OVER THE AGE OF 75
0.0/ 100
METRIC RATING
281st/ 347
METRIC RANK
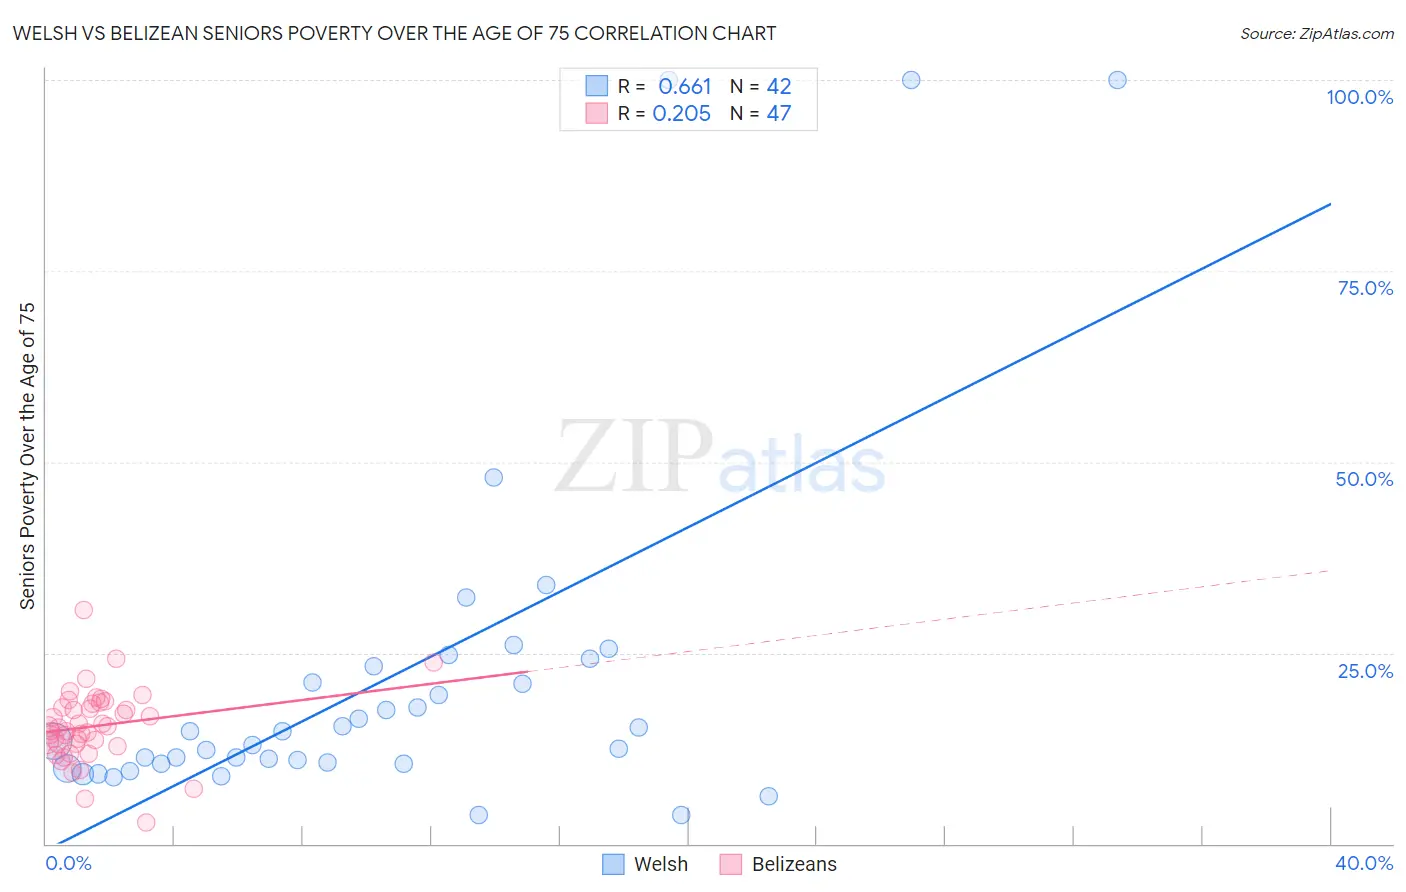
Welsh vs Belizean Seniors Poverty Over the Age of 75 Correlation Chart
The statistical analysis conducted on geographies consisting of 515,966,529 people shows a significant positive correlation between the proportion of Welsh and poverty level among seniors over the age of 75 in the United States with a correlation coefficient (R) of 0.661 and weighted average of 10.5%. Similarly, the statistical analysis conducted on geographies consisting of 143,767,946 people shows a weak positive correlation between the proportion of Belizeans and poverty level among seniors over the age of 75 in the United States with a correlation coefficient (R) of 0.205 and weighted average of 14.8%, a difference of 40.0%.
Seniors Poverty Over the Age of 75 Correlation Summary
| Measurement | Welsh | Belizean |
| Minimum | 3.7% | 2.8% |
| Maximum | 100.0% | 30.5% |
| Range | 96.3% | 27.7% |
| Mean | 21.9% | 15.4% |
| Median | 14.1% | 15.3% |
| Interquartile 25% (IQ1) | 10.4% | 13.1% |
| Interquartile 75% (IQ3) | 23.3% | 18.4% |
| Interquartile Range (IQR) | 12.8% | 5.2% |
| Standard Deviation (Sample) | 23.5% | 4.8% |
| Standard Deviation (Population) | 23.3% | 4.7% |
Similar Demographics by Seniors Poverty Over the Age of 75
Demographics Similar to Welsh by Seniors Poverty Over the Age of 75
In terms of seniors poverty over the age of 75, the demographic groups most similar to Welsh are Slovak (10.5%, a difference of 0.010%), Immigrants from Scotland (10.5%, a difference of 0.040%), Czech (10.5%, a difference of 0.050%), Slovene (10.6%, a difference of 0.090%), and Dutch (10.5%, a difference of 0.21%).
| Demographics | Rating | Rank | Seniors Poverty Over the Age of 75 |
| Immigrants | India | 99.9 /100 | #11 | Exceptional 10.4% |
| Tongans | 99.9 /100 | #12 | Exceptional 10.5% |
| Croatians | 99.9 /100 | #13 | Exceptional 10.5% |
| Scottish | 99.9 /100 | #14 | Exceptional 10.5% |
| Europeans | 99.9 /100 | #15 | Exceptional 10.5% |
| Dutch | 99.9 /100 | #16 | Exceptional 10.5% |
| Slovaks | 99.9 /100 | #17 | Exceptional 10.5% |
| Welsh | 99.9 /100 | #18 | Exceptional 10.5% |
| Immigrants | Scotland | 99.9 /100 | #19 | Exceptional 10.5% |
| Czechs | 99.9 /100 | #20 | Exceptional 10.5% |
| Slovenes | 99.9 /100 | #21 | Exceptional 10.6% |
| Bhutanese | 99.8 /100 | #22 | Exceptional 10.6% |
| Lithuanians | 99.8 /100 | #23 | Exceptional 10.6% |
| Poles | 99.8 /100 | #24 | Exceptional 10.6% |
| Menominee | 99.8 /100 | #25 | Exceptional 10.6% |
Demographics Similar to Belizeans by Seniors Poverty Over the Age of 75
In terms of seniors poverty over the age of 75, the demographic groups most similar to Belizeans are Central American (14.7%, a difference of 0.12%), Immigrants from Senegal (14.8%, a difference of 0.18%), Guatemalan (14.8%, a difference of 0.24%), Black/African American (14.6%, a difference of 0.76%), and Cheyenne (14.9%, a difference of 0.88%).
| Demographics | Rating | Rank | Seniors Poverty Over the Age of 75 |
| Immigrants | Bahamas | 0.0 /100 | #274 | Tragic 14.4% |
| Immigrants | El Salvador | 0.0 /100 | #275 | Tragic 14.5% |
| Soviet Union | 0.0 /100 | #276 | Tragic 14.5% |
| Senegalese | 0.0 /100 | #277 | Tragic 14.5% |
| Immigrants | Colombia | 0.0 /100 | #278 | Tragic 14.6% |
| Blacks/African Americans | 0.0 /100 | #279 | Tragic 14.6% |
| Central Americans | 0.0 /100 | #280 | Tragic 14.7% |
| Belizeans | 0.0 /100 | #281 | Tragic 14.8% |
| Immigrants | Senegal | 0.0 /100 | #282 | Tragic 14.8% |
| Guatemalans | 0.0 /100 | #283 | Tragic 14.8% |
| Cheyenne | 0.0 /100 | #284 | Tragic 14.9% |
| Immigrants | Mexico | 0.0 /100 | #285 | Tragic 14.9% |
| Immigrants | Central America | 0.0 /100 | #286 | Tragic 15.0% |
| Immigrants | Guatemala | 0.0 /100 | #287 | Tragic 15.1% |
| Jamaicans | 0.0 /100 | #288 | Tragic 15.1% |