West Indian vs Brazilian Single Female Poverty
COMPARE
West Indian
Brazilian
Single Female Poverty
Single Female Poverty Comparison
West Indians
Brazilians
22.3%
SINGLE FEMALE POVERTY
1.9/ 100
METRIC RATING
243rd/ 347
METRIC RANK
20.1%
SINGLE FEMALE POVERTY
94.4/ 100
METRIC RATING
123rd/ 347
METRIC RANK
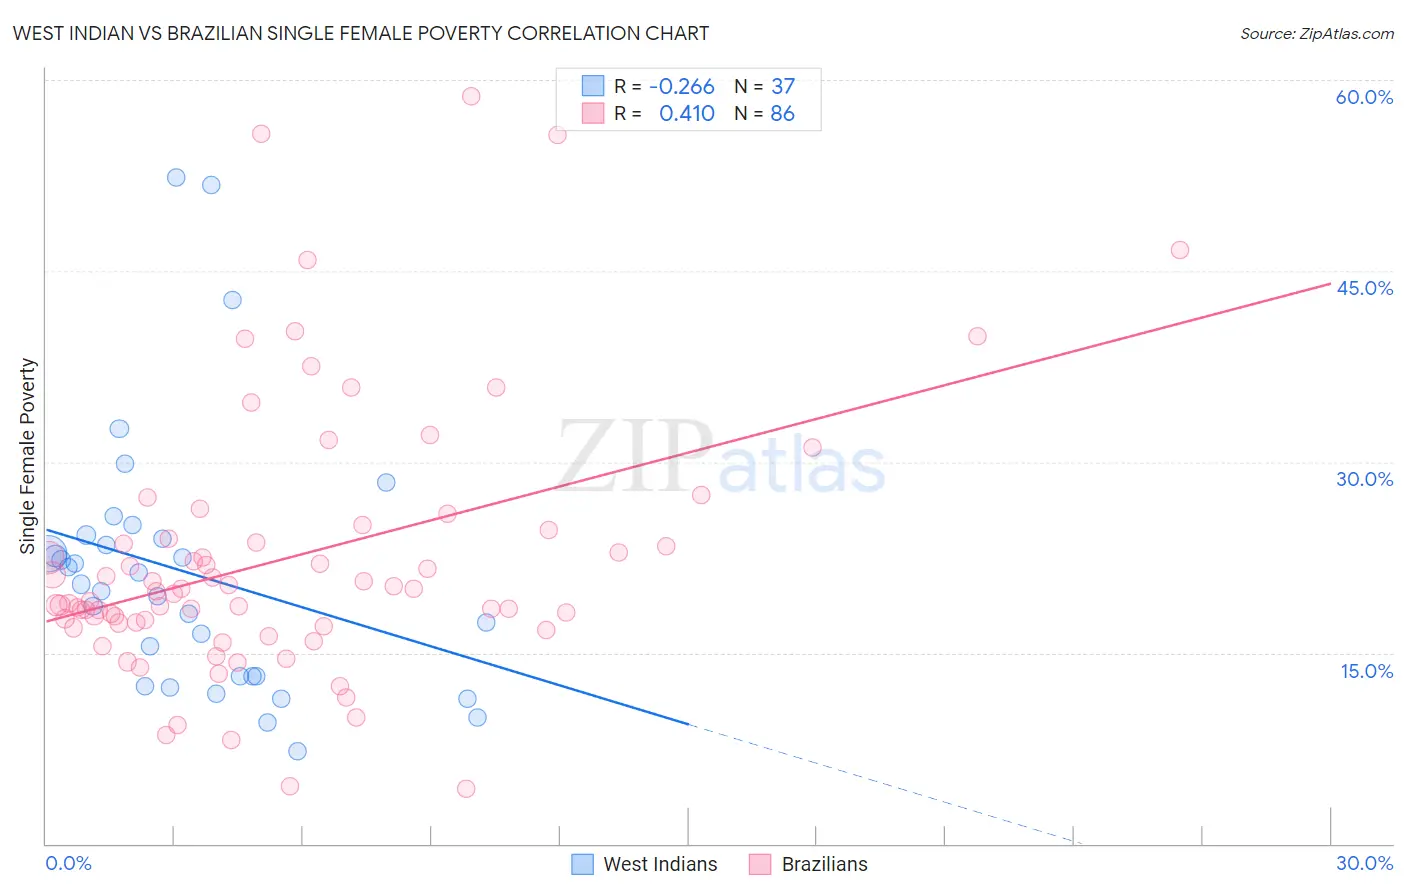
West Indian vs Brazilian Single Female Poverty Correlation Chart
The statistical analysis conducted on geographies consisting of 252,099,029 people shows a weak negative correlation between the proportion of West Indians and poverty level among single females in the United States with a correlation coefficient (R) of -0.266 and weighted average of 22.3%. Similarly, the statistical analysis conducted on geographies consisting of 319,523,574 people shows a moderate positive correlation between the proportion of Brazilians and poverty level among single females in the United States with a correlation coefficient (R) of 0.410 and weighted average of 20.1%, a difference of 11.0%.
Single Female Poverty Correlation Summary
| Measurement | West Indian | Brazilian |
| Minimum | 7.2% | 4.3% |
| Maximum | 52.4% | 58.7% |
| Range | 45.1% | 54.4% |
| Mean | 21.3% | 22.4% |
| Median | 20.4% | 19.7% |
| Interquartile 25% (IQ1) | 13.2% | 17.3% |
| Interquartile 75% (IQ3) | 24.1% | 23.9% |
| Interquartile Range (IQR) | 10.9% | 6.6% |
| Standard Deviation (Sample) | 10.4% | 10.5% |
| Standard Deviation (Population) | 10.2% | 10.4% |
Similar Demographics by Single Female Poverty
Demographics Similar to West Indians by Single Female Poverty
In terms of single female poverty, the demographic groups most similar to West Indians are Immigrants from Middle Africa (22.3%, a difference of 0.010%), Immigrants from Bangladesh (22.3%, a difference of 0.050%), Bermudan (22.3%, a difference of 0.090%), Cape Verdean (22.3%, a difference of 0.16%), and French (22.2%, a difference of 0.30%).
| Demographics | Rating | Rank | Single Female Poverty |
| Immigrants | Ecuador | 4.2 /100 | #236 | Tragic 22.0% |
| Vietnamese | 4.0 /100 | #237 | Tragic 22.0% |
| French Canadians | 2.8 /100 | #238 | Tragic 22.2% |
| Malaysians | 2.8 /100 | #239 | Tragic 22.2% |
| French | 2.3 /100 | #240 | Tragic 22.2% |
| Cape Verdeans | 2.1 /100 | #241 | Tragic 22.3% |
| Bermudans | 2.0 /100 | #242 | Tragic 22.3% |
| West Indians | 1.9 /100 | #243 | Tragic 22.3% |
| Immigrants | Middle Africa | 1.9 /100 | #244 | Tragic 22.3% |
| Immigrants | Bangladesh | 1.8 /100 | #245 | Tragic 22.3% |
| Liberians | 1.4 /100 | #246 | Tragic 22.4% |
| Immigrants | El Salvador | 1.4 /100 | #247 | Tragic 22.4% |
| Belizeans | 1.4 /100 | #248 | Tragic 22.4% |
| Immigrants | Caribbean | 1.3 /100 | #249 | Tragic 22.4% |
| Immigrants | Bahamas | 1.2 /100 | #250 | Tragic 22.5% |
Demographics Similar to Brazilians by Single Female Poverty
In terms of single female poverty, the demographic groups most similar to Brazilians are Immigrants from Chile (20.1%, a difference of 0.030%), Immigrants from South Africa (20.1%, a difference of 0.15%), Immigrants from South America (20.0%, a difference of 0.18%), Immigrants from Switzerland (20.0%, a difference of 0.21%), and South American (20.0%, a difference of 0.24%).
| Demographics | Rating | Rank | Single Female Poverty |
| Immigrants | Kazakhstan | 95.7 /100 | #116 | Exceptional 20.0% |
| Poles | 95.6 /100 | #117 | Exceptional 20.0% |
| Immigrants | Afghanistan | 95.4 /100 | #118 | Exceptional 20.0% |
| Immigrants | Ethiopia | 95.4 /100 | #119 | Exceptional 20.0% |
| South Americans | 95.1 /100 | #120 | Exceptional 20.0% |
| Immigrants | Switzerland | 95.1 /100 | #121 | Exceptional 20.0% |
| Immigrants | South America | 95.0 /100 | #122 | Exceptional 20.0% |
| Brazilians | 94.4 /100 | #123 | Exceptional 20.1% |
| Immigrants | Chile | 94.3 /100 | #124 | Exceptional 20.1% |
| Immigrants | South Africa | 93.9 /100 | #125 | Exceptional 20.1% |
| Serbians | 93.3 /100 | #126 | Exceptional 20.1% |
| Mongolians | 93.2 /100 | #127 | Exceptional 20.2% |
| Immigrants | Spain | 92.7 /100 | #128 | Exceptional 20.2% |
| Immigrants | Morocco | 92.4 /100 | #129 | Exceptional 20.2% |
| Immigrants | Hungary | 92.3 /100 | #130 | Exceptional 20.2% |