White/Caucasian vs Immigrants from Jordan Female Poverty
COMPARE
White/Caucasian
Immigrants from Jordan
Female Poverty
Female Poverty Comparison
Whites/Caucasians
Immigrants from Jordan
13.4%
FEMALE POVERTY
54.6/ 100
METRIC RATING
171st/ 347
METRIC RANK
12.8%
FEMALE POVERTY
86.9/ 100
METRIC RATING
132nd/ 347
METRIC RANK
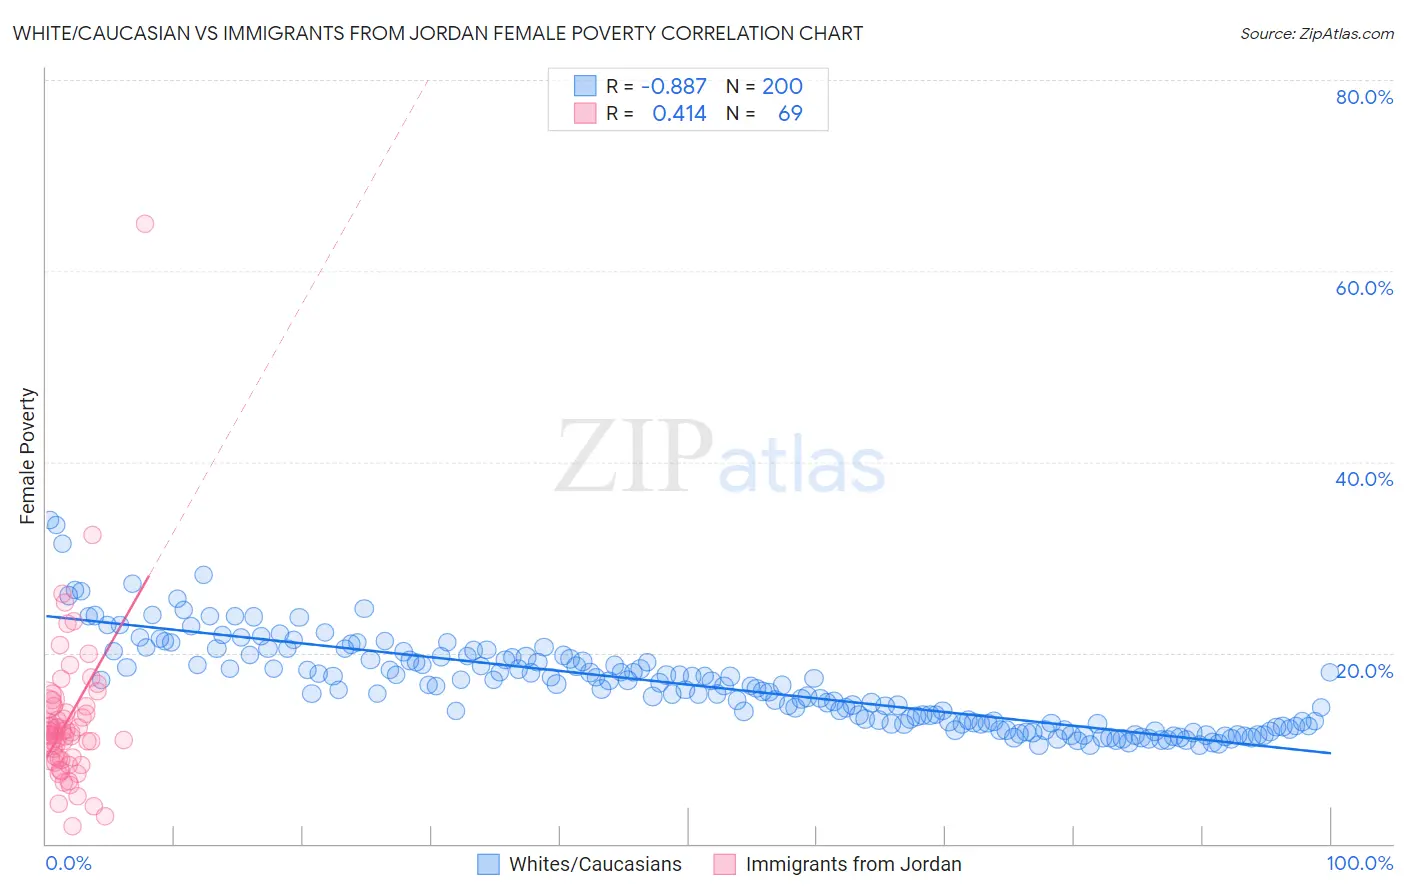
White/Caucasian vs Immigrants from Jordan Female Poverty Correlation Chart
The statistical analysis conducted on geographies consisting of 583,112,868 people shows a very strong negative correlation between the proportion of Whites/Caucasians and poverty level among females in the United States with a correlation coefficient (R) of -0.887 and weighted average of 13.4%. Similarly, the statistical analysis conducted on geographies consisting of 181,244,945 people shows a moderate positive correlation between the proportion of Immigrants from Jordan and poverty level among females in the United States with a correlation coefficient (R) of 0.414 and weighted average of 12.8%, a difference of 4.3%.
Female Poverty Correlation Summary
| Measurement | White/Caucasian | Immigrants from Jordan |
| Minimum | 10.3% | 1.8% |
| Maximum | 33.9% | 64.9% |
| Range | 23.6% | 63.1% |
| Mean | 16.7% | 13.0% |
| Median | 16.5% | 11.7% |
| Interquartile 25% (IQ1) | 12.6% | 8.8% |
| Interquartile 75% (IQ3) | 19.6% | 14.5% |
| Interquartile Range (IQR) | 7.0% | 5.7% |
| Standard Deviation (Sample) | 4.7% | 8.4% |
| Standard Deviation (Population) | 4.7% | 8.3% |
Similar Demographics by Female Poverty
Demographics Similar to Whites/Caucasians by Female Poverty
In terms of female poverty, the demographic groups most similar to Whites/Caucasians are Mongolian (13.4%, a difference of 0.10%), Colombian (13.4%, a difference of 0.11%), Lebanese (13.4%, a difference of 0.13%), Aleut (13.4%, a difference of 0.21%), and Immigrants from Chile (13.3%, a difference of 0.27%).
| Demographics | Rating | Rank | Female Poverty |
| Ethiopians | 62.3 /100 | #164 | Good 13.3% |
| Scotch-Irish | 62.1 /100 | #165 | Good 13.3% |
| Immigrants | Oceania | 59.7 /100 | #166 | Average 13.3% |
| Immigrants | Chile | 57.4 /100 | #167 | Average 13.3% |
| Aleuts | 56.7 /100 | #168 | Average 13.4% |
| Lebanese | 55.9 /100 | #169 | Average 13.4% |
| Colombians | 55.7 /100 | #170 | Average 13.4% |
| Whites/Caucasians | 54.6 /100 | #171 | Average 13.4% |
| Mongolians | 53.6 /100 | #172 | Average 13.4% |
| Immigrants | Afghanistan | 50.8 /100 | #173 | Average 13.4% |
| Immigrants | Iraq | 50.0 /100 | #174 | Average 13.4% |
| Celtics | 49.9 /100 | #175 | Average 13.4% |
| Immigrants | Spain | 49.9 /100 | #176 | Average 13.4% |
| Immigrants | Morocco | 49.4 /100 | #177 | Average 13.4% |
| Israelis | 49.1 /100 | #178 | Average 13.5% |
Demographics Similar to Immigrants from Jordan by Female Poverty
In terms of female poverty, the demographic groups most similar to Immigrants from Jordan are Immigrants from Argentina (12.8%, a difference of 0.010%), Immigrants from Vietnam (12.8%, a difference of 0.050%), Immigrants from Western Europe (12.8%, a difference of 0.060%), Immigrants from Switzerland (12.9%, a difference of 0.22%), and Immigrants from Brazil (12.8%, a difference of 0.24%).
| Demographics | Rating | Rank | Female Poverty |
| Argentineans | 89.1 /100 | #125 | Excellent 12.8% |
| Immigrants | Ukraine | 88.8 /100 | #126 | Excellent 12.8% |
| South Africans | 88.4 /100 | #127 | Excellent 12.8% |
| Immigrants | Belarus | 88.2 /100 | #128 | Excellent 12.8% |
| Immigrants | Brazil | 87.9 /100 | #129 | Excellent 12.8% |
| Immigrants | Vietnam | 87.1 /100 | #130 | Excellent 12.8% |
| Immigrants | Argentina | 87.0 /100 | #131 | Excellent 12.8% |
| Immigrants | Jordan | 86.9 /100 | #132 | Excellent 12.8% |
| Immigrants | Western Europe | 86.6 /100 | #133 | Excellent 12.8% |
| Immigrants | Switzerland | 85.8 /100 | #134 | Excellent 12.9% |
| French | 85.6 /100 | #135 | Excellent 12.9% |
| Peruvians | 85.2 /100 | #136 | Excellent 12.9% |
| Chileans | 84.7 /100 | #137 | Excellent 12.9% |
| Immigrants | France | 83.6 /100 | #138 | Excellent 12.9% |
| Basques | 83.1 /100 | #139 | Excellent 12.9% |