Yuman vs Immigrants from Lithuania Family Poverty
COMPARE
Yuman
Immigrants from Lithuania
Family Poverty
Family Poverty Comparison
Yuman
Immigrants from Lithuania
16.6%
FAMILY POVERTY
0.0/ 100
METRIC RATING
339th/ 347
METRIC RANK
7.2%
FAMILY POVERTY
99.8/ 100
METRIC RATING
18th/ 347
METRIC RANK
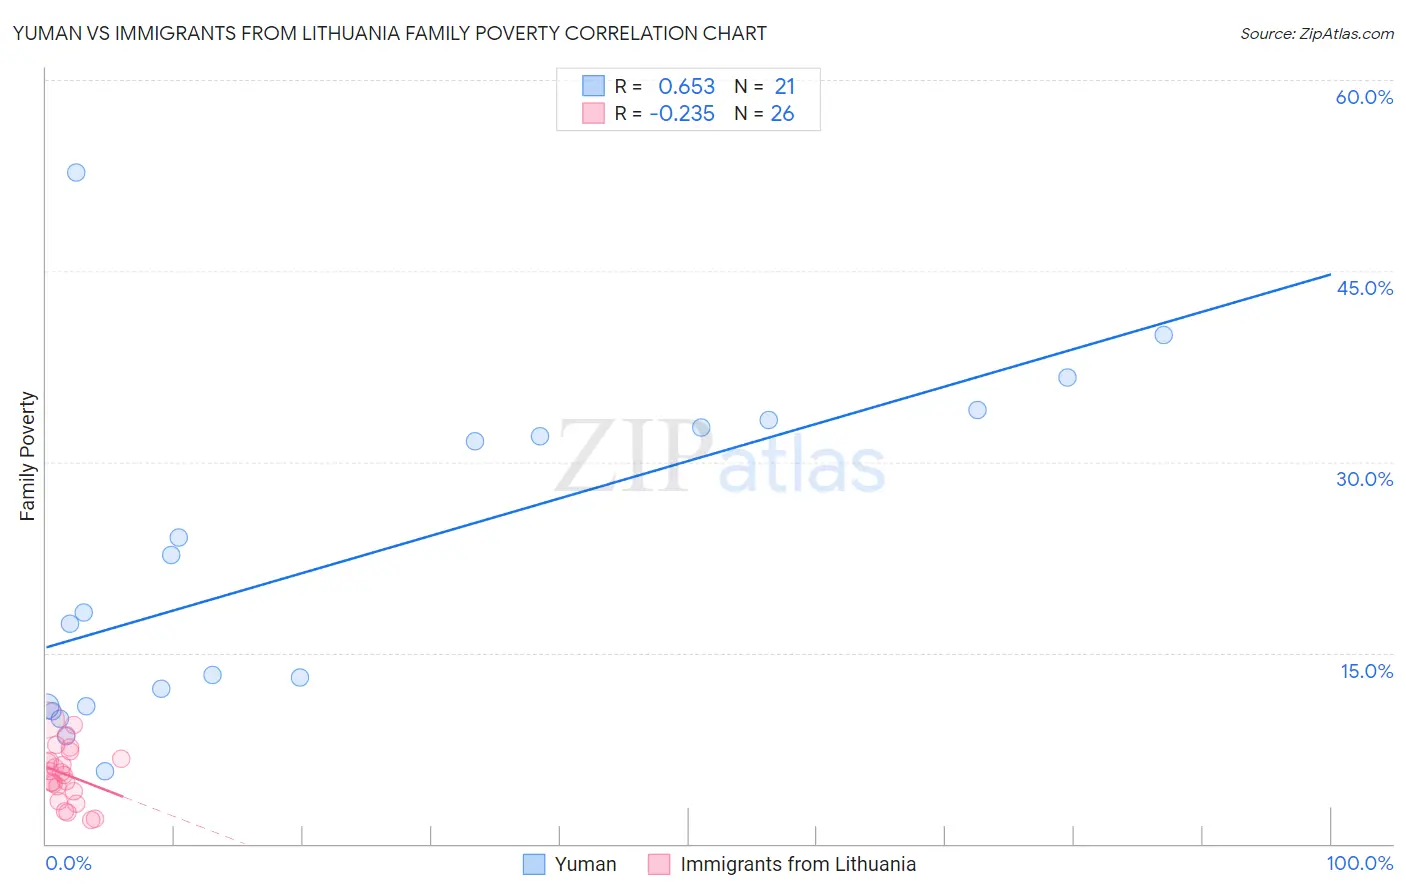
Yuman vs Immigrants from Lithuania Family Poverty Correlation Chart
The statistical analysis conducted on geographies consisting of 40,648,846 people shows a significant positive correlation between the proportion of Yuman and poverty level among families in the United States with a correlation coefficient (R) of 0.653 and weighted average of 16.6%. Similarly, the statistical analysis conducted on geographies consisting of 117,605,958 people shows a weak negative correlation between the proportion of Immigrants from Lithuania and poverty level among families in the United States with a correlation coefficient (R) of -0.235 and weighted average of 7.2%, a difference of 130.4%.
Family Poverty Correlation Summary
| Measurement | Yuman | Immigrants from Lithuania |
| Minimum | 5.7% | 1.9% |
| Maximum | 52.7% | 9.7% |
| Range | 47.0% | 7.8% |
| Mean | 22.4% | 5.5% |
| Median | 18.2% | 5.5% |
| Interquartile 25% (IQ1) | 10.8% | 4.1% |
| Interquartile 75% (IQ3) | 33.0% | 6.7% |
| Interquartile Range (IQR) | 22.2% | 2.5% |
| Standard Deviation (Sample) | 12.9% | 2.2% |
| Standard Deviation (Population) | 12.6% | 2.1% |
Similar Demographics by Family Poverty
Demographics Similar to Yuman by Family Poverty
In terms of family poverty, the demographic groups most similar to Yuman are Pueblo (17.0%, a difference of 2.1%), Lumbee (17.0%, a difference of 2.1%), Crow (16.1%, a difference of 3.3%), Hopi (15.9%, a difference of 4.5%), and Sioux (15.9%, a difference of 5.0%).
| Demographics | Rating | Rank | Family Poverty |
| Dominicans | 0.0 /100 | #332 | Tragic 14.3% |
| Immigrants | Dominican Republic | 0.0 /100 | #333 | Tragic 14.4% |
| Houma | 0.0 /100 | #334 | Tragic 14.6% |
| Apache | 0.0 /100 | #335 | Tragic 14.7% |
| Sioux | 0.0 /100 | #336 | Tragic 15.9% |
| Hopi | 0.0 /100 | #337 | Tragic 15.9% |
| Crow | 0.0 /100 | #338 | Tragic 16.1% |
| Yuman | 0.0 /100 | #339 | Tragic 16.6% |
| Pueblo | 0.0 /100 | #340 | Tragic 17.0% |
| Lumbee | 0.0 /100 | #341 | Tragic 17.0% |
| Immigrants | Yemen | 0.0 /100 | #342 | Tragic 17.5% |
| Pima | 0.0 /100 | #343 | Tragic 18.4% |
| Yup'ik | 0.0 /100 | #344 | Tragic 18.7% |
| Navajo | 0.0 /100 | #345 | Tragic 18.8% |
| Puerto Ricans | 0.0 /100 | #346 | Tragic 20.3% |
Demographics Similar to Immigrants from Lithuania by Family Poverty
In terms of family poverty, the demographic groups most similar to Immigrants from Lithuania are Luxembourger (7.2%, a difference of 0.010%), Immigrants from South Central Asia (7.2%, a difference of 0.24%), Eastern European (7.2%, a difference of 0.30%), Immigrants from Hong Kong (7.3%, a difference of 0.46%), and Lithuanian (7.2%, a difference of 0.51%).
| Demographics | Rating | Rank | Family Poverty |
| Immigrants | Singapore | 99.8 /100 | #11 | Exceptional 7.1% |
| Maltese | 99.8 /100 | #12 | Exceptional 7.1% |
| Swedes | 99.8 /100 | #13 | Exceptional 7.1% |
| Iranians | 99.8 /100 | #14 | Exceptional 7.1% |
| Lithuanians | 99.8 /100 | #15 | Exceptional 7.2% |
| Immigrants | South Central Asia | 99.8 /100 | #16 | Exceptional 7.2% |
| Luxembourgers | 99.8 /100 | #17 | Exceptional 7.2% |
| Immigrants | Lithuania | 99.8 /100 | #18 | Exceptional 7.2% |
| Eastern Europeans | 99.7 /100 | #19 | Exceptional 7.2% |
| Immigrants | Hong Kong | 99.7 /100 | #20 | Exceptional 7.3% |
| Immigrants | Iran | 99.7 /100 | #21 | Exceptional 7.3% |
| Danes | 99.7 /100 | #22 | Exceptional 7.3% |
| Assyrians/Chaldeans/Syriacs | 99.7 /100 | #23 | Exceptional 7.3% |
| Croatians | 99.7 /100 | #24 | Exceptional 7.3% |
| Burmese | 99.7 /100 | #25 | Exceptional 7.3% |