Aleut vs German Russian Unemployment Among Seniors over 65 years
COMPARE
Aleut
German Russian
Unemployment Among Seniors over 65 years
Unemployment Among Seniors over 65 years Comparison
Aleuts
German Russians
6.0%
UNEMPLOYMENT AMONG SENIORS OVER 65 YEARS
0.0/ 100
METRIC RATING
332nd/ 347
METRIC RANK
5.2%
UNEMPLOYMENT AMONG SENIORS OVER 65 YEARS
14.7/ 100
METRIC RATING
206th/ 347
METRIC RANK
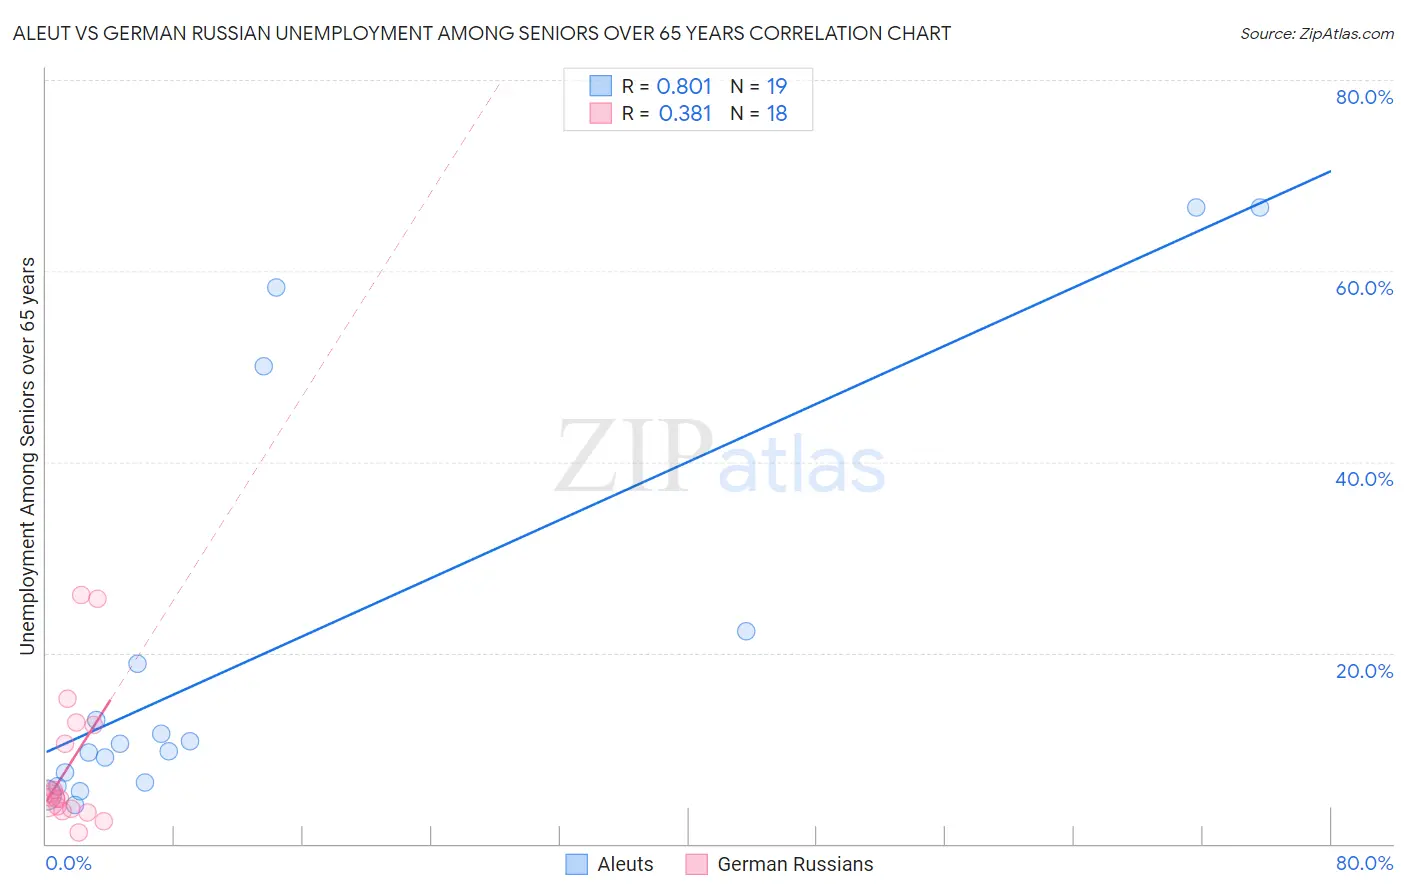
Aleut vs German Russian Unemployment Among Seniors over 65 years Correlation Chart
The statistical analysis conducted on geographies consisting of 59,181,284 people shows a very strong positive correlation between the proportion of Aleuts and unemployment rate amomg seniors over the age of 65 in the United States with a correlation coefficient (R) of 0.801 and weighted average of 6.0%. Similarly, the statistical analysis conducted on geographies consisting of 91,757,788 people shows a mild positive correlation between the proportion of German Russians and unemployment rate amomg seniors over the age of 65 in the United States with a correlation coefficient (R) of 0.381 and weighted average of 5.2%, a difference of 14.5%.
Unemployment Among Seniors over 65 years Correlation Summary
| Measurement | Aleut | German Russian |
| Minimum | 4.1% | 1.2% |
| Maximum | 66.6% | 26.1% |
| Range | 62.5% | 24.9% |
| Mean | 20.6% | 8.3% |
| Median | 10.5% | 4.8% |
| Interquartile 25% (IQ1) | 6.4% | 3.6% |
| Interquartile 75% (IQ3) | 22.2% | 12.5% |
| Interquartile Range (IQR) | 15.8% | 8.9% |
| Standard Deviation (Sample) | 21.8% | 7.5% |
| Standard Deviation (Population) | 21.2% | 7.3% |
Similar Demographics by Unemployment Among Seniors over 65 years
Demographics Similar to Aleuts by Unemployment Among Seniors over 65 years
In terms of unemployment among seniors over 65 years, the demographic groups most similar to Aleuts are Taiwanese (6.0%, a difference of 0.050%), Immigrants from Portugal (6.0%, a difference of 0.20%), Dominican (6.0%, a difference of 0.22%), Immigrants from Dominican Republic (6.0%, a difference of 0.55%), and Puerto Rican (5.9%, a difference of 0.97%).
| Demographics | Rating | Rank | Unemployment Among Seniors over 65 years |
| Inupiat | 0.0 /100 | #325 | Tragic 5.8% |
| Shoshone | 0.0 /100 | #326 | Tragic 5.9% |
| Bermudans | 0.0 /100 | #327 | Tragic 5.9% |
| Puerto Ricans | 0.0 /100 | #328 | Tragic 5.9% |
| Dominicans | 0.0 /100 | #329 | Tragic 6.0% |
| Immigrants | Portugal | 0.0 /100 | #330 | Tragic 6.0% |
| Taiwanese | 0.0 /100 | #331 | Tragic 6.0% |
| Aleuts | 0.0 /100 | #332 | Tragic 6.0% |
| Immigrants | Dominican Republic | 0.0 /100 | #333 | Tragic 6.0% |
| Tohono O'odham | 0.0 /100 | #334 | Tragic 6.1% |
| Immigrants | Armenia | 0.0 /100 | #335 | Tragic 6.2% |
| Pima | 0.0 /100 | #336 | Tragic 6.3% |
| Alaska Natives | 0.0 /100 | #337 | Tragic 6.3% |
| Immigrants | Azores | 0.0 /100 | #338 | Tragic 6.3% |
| Paiute | 0.0 /100 | #339 | Tragic 6.3% |
Demographics Similar to German Russians by Unemployment Among Seniors over 65 years
In terms of unemployment among seniors over 65 years, the demographic groups most similar to German Russians are South American Indian (5.2%, a difference of 0.040%), Immigrants from Philippines (5.2%, a difference of 0.10%), Immigrants from China (5.2%, a difference of 0.13%), Subsaharan African (5.2%, a difference of 0.14%), and Uruguayan (5.2%, a difference of 0.14%).
| Demographics | Rating | Rank | Unemployment Among Seniors over 65 years |
| Immigrants | Europe | 19.0 /100 | #199 | Poor 5.2% |
| Immigrants | Pakistan | 18.4 /100 | #200 | Poor 5.2% |
| Laotians | 18.1 /100 | #201 | Poor 5.2% |
| Immigrants | Northern Africa | 17.7 /100 | #202 | Poor 5.2% |
| Sub-Saharan Africans | 17.1 /100 | #203 | Poor 5.2% |
| Immigrants | China | 16.9 /100 | #204 | Poor 5.2% |
| South American Indians | 15.3 /100 | #205 | Poor 5.2% |
| German Russians | 14.7 /100 | #206 | Poor 5.2% |
| Immigrants | Philippines | 13.2 /100 | #207 | Poor 5.2% |
| Uruguayans | 12.6 /100 | #208 | Poor 5.2% |
| Alsatians | 11.4 /100 | #209 | Poor 5.2% |
| Immigrants | Uzbekistan | 10.7 /100 | #210 | Poor 5.2% |
| Africans | 10.4 /100 | #211 | Poor 5.2% |
| Immigrants | Honduras | 10.2 /100 | #212 | Poor 5.2% |
| Immigrants | Uruguay | 9.3 /100 | #213 | Tragic 5.2% |