Arab vs Cree Male Unemployment
COMPARE
Arab
Cree
Male Unemployment
Male Unemployment Comparison
Arabs
Cree
5.4%
MALE UNEMPLOYMENT
30.2/ 100
METRIC RATING
188th/ 347
METRIC RANK
5.7%
MALE UNEMPLOYMENT
0.4/ 100
METRIC RATING
249th/ 347
METRIC RANK
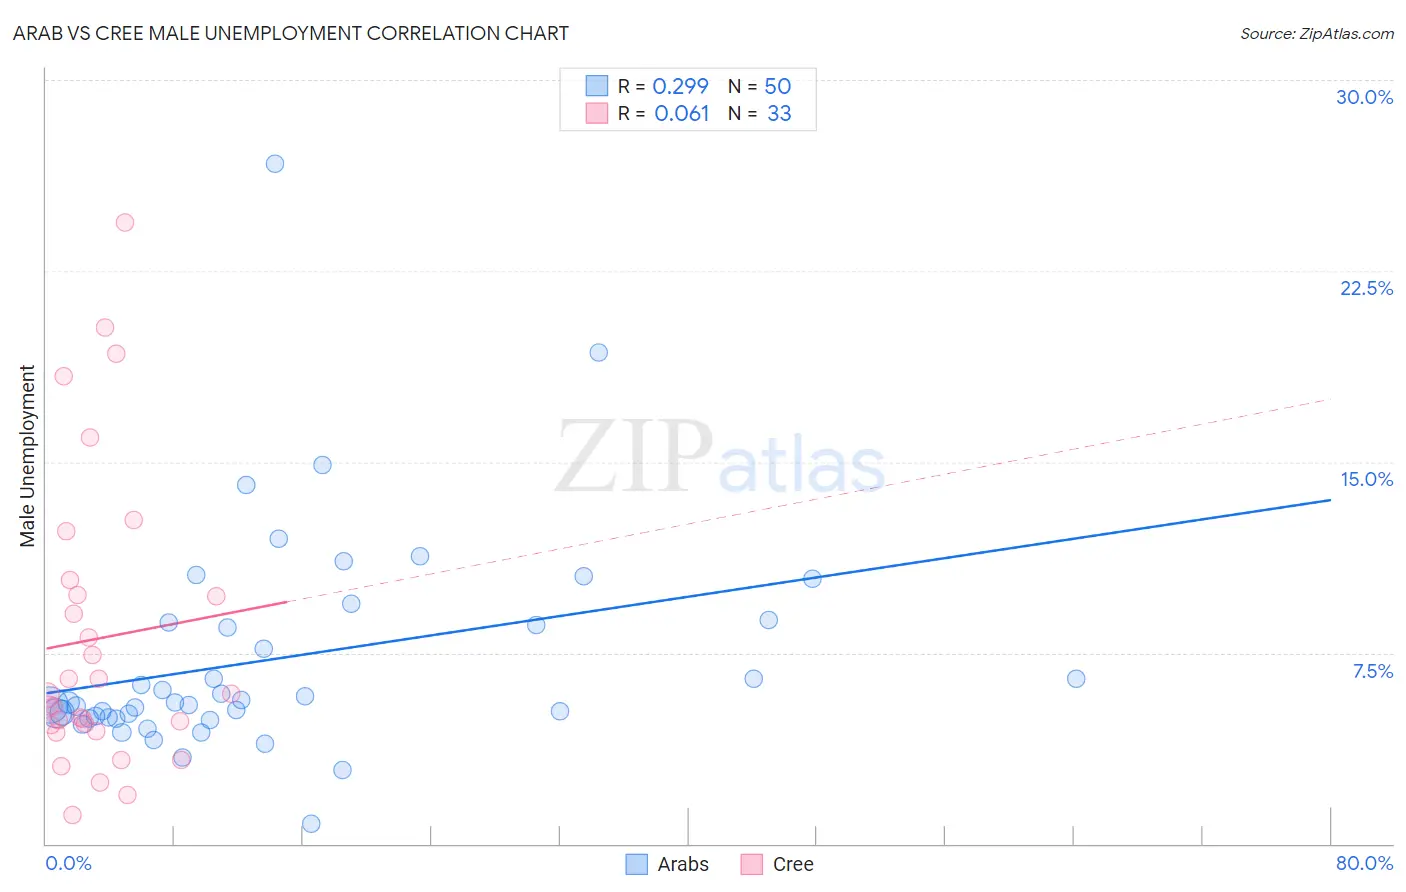
Arab vs Cree Male Unemployment Correlation Chart
The statistical analysis conducted on geographies consisting of 483,718,645 people shows a weak positive correlation between the proportion of Arabs and unemployment rate among males in the United States with a correlation coefficient (R) of 0.299 and weighted average of 5.4%. Similarly, the statistical analysis conducted on geographies consisting of 76,096,114 people shows a slight positive correlation between the proportion of Cree and unemployment rate among males in the United States with a correlation coefficient (R) of 0.061 and weighted average of 5.7%, a difference of 6.6%.
Male Unemployment Correlation Summary
| Measurement | Arab | Cree |
| Minimum | 0.80% | 1.1% |
| Maximum | 26.7% | 24.4% |
| Range | 25.9% | 23.3% |
| Mean | 7.3% | 8.1% |
| Median | 5.5% | 5.8% |
| Interquartile 25% (IQ1) | 4.9% | 4.5% |
| Interquartile 75% (IQ3) | 8.7% | 10.1% |
| Interquartile Range (IQR) | 3.7% | 5.5% |
| Standard Deviation (Sample) | 4.4% | 5.8% |
| Standard Deviation (Population) | 4.3% | 5.7% |
Similar Demographics by Male Unemployment
Demographics Similar to Arabs by Male Unemployment
In terms of male unemployment, the demographic groups most similar to Arabs are Immigrants from South America (5.4%, a difference of 0.060%), Costa Rican (5.4%, a difference of 0.080%), Iraqi (5.4%, a difference of 0.090%), Immigrants from Uganda (5.4%, a difference of 0.10%), and Immigrants from South Eastern Asia (5.4%, a difference of 0.14%).
| Demographics | Rating | Rank | Male Unemployment |
| Immigrants | Afghanistan | 37.9 /100 | #181 | Fair 5.3% |
| Potawatomi | 37.8 /100 | #182 | Fair 5.3% |
| Taiwanese | 37.6 /100 | #183 | Fair 5.3% |
| Spaniards | 35.1 /100 | #184 | Fair 5.3% |
| Koreans | 34.9 /100 | #185 | Fair 5.3% |
| Iraqis | 31.6 /100 | #186 | Fair 5.4% |
| Costa Ricans | 31.3 /100 | #187 | Fair 5.4% |
| Arabs | 30.2 /100 | #188 | Fair 5.4% |
| Immigrants | South America | 29.4 /100 | #189 | Fair 5.4% |
| Immigrants | Uganda | 28.8 /100 | #190 | Fair 5.4% |
| Immigrants | South Eastern Asia | 28.2 /100 | #191 | Fair 5.4% |
| Immigrants | Belarus | 26.0 /100 | #192 | Fair 5.4% |
| Immigrants | Israel | 25.2 /100 | #193 | Fair 5.4% |
| Spanish | 19.7 /100 | #194 | Poor 5.4% |
| Immigrants | Southern Europe | 17.7 /100 | #195 | Poor 5.4% |
Demographics Similar to Cree by Male Unemployment
In terms of male unemployment, the demographic groups most similar to Cree are Marshallese (5.7%, a difference of 0.070%), Immigrants from Bahamas (5.7%, a difference of 0.24%), Spanish American (5.7%, a difference of 0.29%), Hawaiian (5.7%, a difference of 0.39%), and Iroquois (5.7%, a difference of 0.48%).
| Demographics | Rating | Rank | Male Unemployment |
| Ottawa | 0.9 /100 | #242 | Tragic 5.7% |
| Bangladeshis | 0.8 /100 | #243 | Tragic 5.7% |
| Immigrants | El Salvador | 0.7 /100 | #244 | Tragic 5.7% |
| Yaqui | 0.7 /100 | #245 | Tragic 5.7% |
| Iroquois | 0.6 /100 | #246 | Tragic 5.7% |
| Hawaiians | 0.6 /100 | #247 | Tragic 5.7% |
| Marshallese | 0.5 /100 | #248 | Tragic 5.7% |
| Cree | 0.4 /100 | #249 | Tragic 5.7% |
| Immigrants | Bahamas | 0.4 /100 | #250 | Tragic 5.7% |
| Spanish Americans | 0.3 /100 | #251 | Tragic 5.7% |
| Mexicans | 0.2 /100 | #252 | Tragic 5.8% |
| Mexican American Indians | 0.2 /100 | #253 | Tragic 5.8% |
| Japanese | 0.2 /100 | #254 | Tragic 5.8% |
| Kiowa | 0.2 /100 | #255 | Tragic 5.8% |
| Comanche | 0.2 /100 | #256 | Tragic 5.8% |