Argentinean vs Liberian Unemployment Among Seniors over 65 years
COMPARE
Argentinean
Liberian
Unemployment Among Seniors over 65 years
Unemployment Among Seniors over 65 years Comparison
Argentineans
Liberians
5.2%
UNEMPLOYMENT AMONG SENIORS OVER 65 YEARS
29.1/ 100
METRIC RATING
194th/ 347
METRIC RANK
5.6%
UNEMPLOYMENT AMONG SENIORS OVER 65 YEARS
0.0/ 100
METRIC RATING
304th/ 347
METRIC RANK
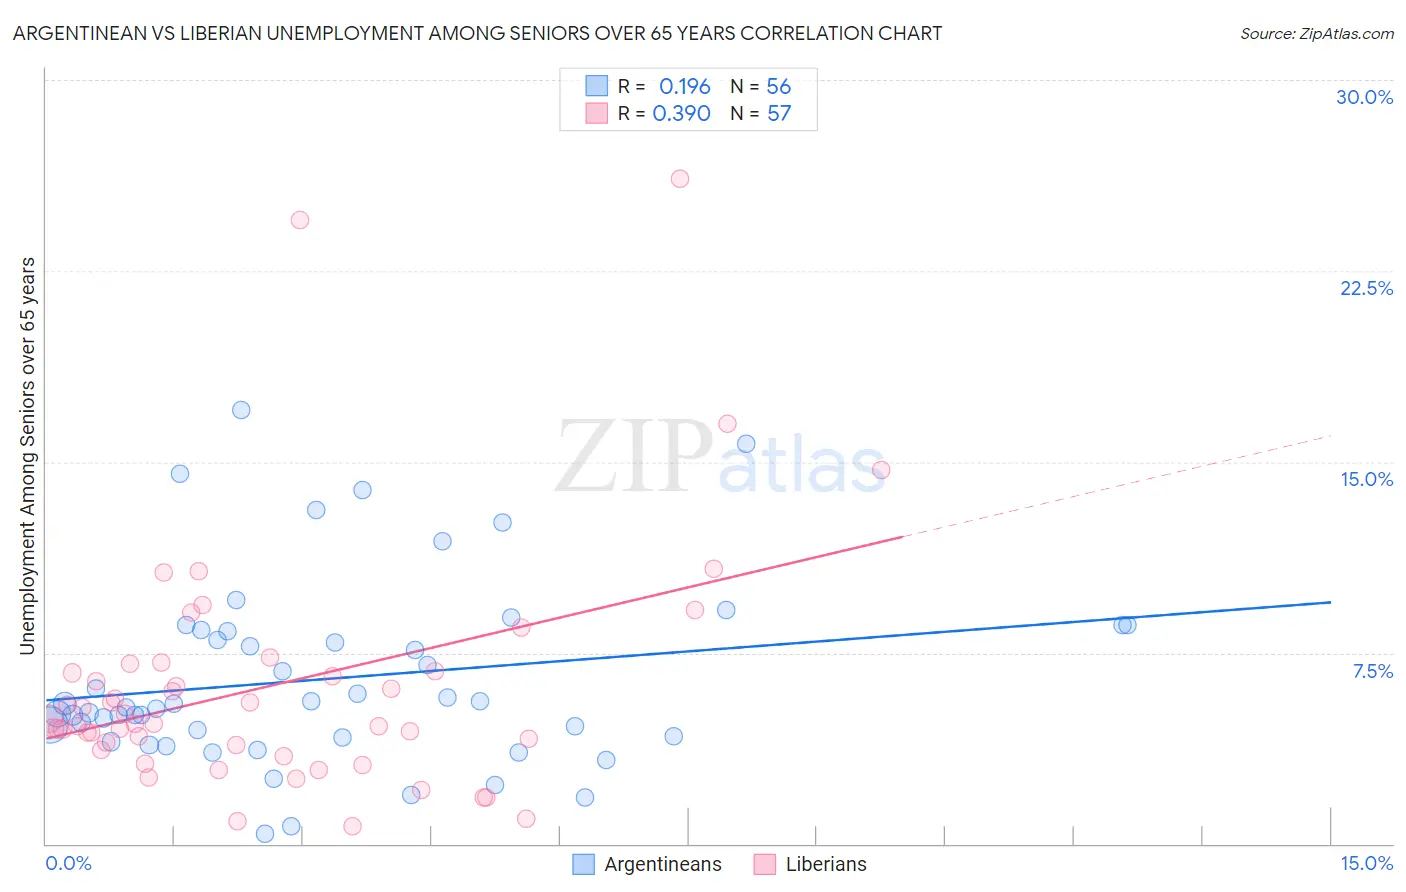
Argentinean vs Liberian Unemployment Among Seniors over 65 years Correlation Chart
The statistical analysis conducted on geographies consisting of 277,763,144 people shows a poor positive correlation between the proportion of Argentineans and unemployment rate amomg seniors over the age of 65 in the United States with a correlation coefficient (R) of 0.196 and weighted average of 5.2%. Similarly, the statistical analysis conducted on geographies consisting of 113,645,931 people shows a mild positive correlation between the proportion of Liberians and unemployment rate amomg seniors over the age of 65 in the United States with a correlation coefficient (R) of 0.390 and weighted average of 5.6%, a difference of 7.9%.
Unemployment Among Seniors over 65 years Correlation Summary
| Measurement | Argentinean | Liberian |
| Minimum | 0.40% | 0.70% |
| Maximum | 17.0% | 26.1% |
| Range | 16.6% | 25.4% |
| Mean | 6.5% | 6.2% |
| Median | 5.4% | 4.7% |
| Interquartile 25% (IQ1) | 4.2% | 3.8% |
| Interquartile 75% (IQ3) | 8.4% | 6.9% |
| Interquartile Range (IQR) | 4.2% | 3.1% |
| Standard Deviation (Sample) | 3.6% | 4.8% |
| Standard Deviation (Population) | 3.6% | 4.7% |
Similar Demographics by Unemployment Among Seniors over 65 years
Demographics Similar to Argentineans by Unemployment Among Seniors over 65 years
In terms of unemployment among seniors over 65 years, the demographic groups most similar to Argentineans are Immigrants from Africa (5.2%, a difference of 0.020%), Immigrants from Denmark (5.2%, a difference of 0.070%), Sioux (5.2%, a difference of 0.070%), Costa Rican (5.2%, a difference of 0.080%), and Korean (5.2%, a difference of 0.090%).
| Demographics | Rating | Rank | Unemployment Among Seniors over 65 years |
| Somalis | 33.5 /100 | #187 | Fair 5.2% |
| Immigrants | Egypt | 33.2 /100 | #188 | Fair 5.2% |
| Bangladeshis | 32.3 /100 | #189 | Fair 5.2% |
| Koreans | 31.6 /100 | #190 | Fair 5.2% |
| Immigrants | Denmark | 31.0 /100 | #191 | Fair 5.2% |
| Sioux | 30.8 /100 | #192 | Fair 5.2% |
| Immigrants | Africa | 29.6 /100 | #193 | Fair 5.2% |
| Argentineans | 29.1 /100 | #194 | Fair 5.2% |
| Costa Ricans | 27.0 /100 | #195 | Fair 5.2% |
| Immigrants | Poland | 24.3 /100 | #196 | Fair 5.2% |
| Guamanians/Chamorros | 22.5 /100 | #197 | Fair 5.2% |
| Maltese | 19.6 /100 | #198 | Poor 5.2% |
| Immigrants | Europe | 19.0 /100 | #199 | Poor 5.2% |
| Immigrants | Pakistan | 18.4 /100 | #200 | Poor 5.2% |
| Laotians | 18.1 /100 | #201 | Poor 5.2% |
Demographics Similar to Liberians by Unemployment Among Seniors over 65 years
In terms of unemployment among seniors over 65 years, the demographic groups most similar to Liberians are Immigrants from Latin America (5.6%, a difference of 0.070%), Mexican (5.6%, a difference of 0.16%), Guatemalan (5.6%, a difference of 0.17%), Ecuadorian (5.6%, a difference of 0.21%), and Portuguese (5.6%, a difference of 0.25%).
| Demographics | Rating | Rank | Unemployment Among Seniors over 65 years |
| Yaqui | 0.0 /100 | #297 | Tragic 5.5% |
| Immigrants | West Indies | 0.0 /100 | #298 | Tragic 5.6% |
| Guyanese | 0.0 /100 | #299 | Tragic 5.6% |
| Zimbabweans | 0.0 /100 | #300 | Tragic 5.6% |
| Hispanics or Latinos | 0.0 /100 | #301 | Tragic 5.6% |
| Guatemalans | 0.0 /100 | #302 | Tragic 5.6% |
| Immigrants | Latin America | 0.0 /100 | #303 | Tragic 5.6% |
| Liberians | 0.0 /100 | #304 | Tragic 5.6% |
| Mexicans | 0.0 /100 | #305 | Tragic 5.6% |
| Ecuadorians | 0.0 /100 | #306 | Tragic 5.6% |
| Portuguese | 0.0 /100 | #307 | Tragic 5.6% |
| Immigrants | St. Vincent and the Grenadines | 0.0 /100 | #308 | Tragic 5.6% |
| Immigrants | Guatemala | 0.0 /100 | #309 | Tragic 5.6% |
| Salvadorans | 0.0 /100 | #310 | Tragic 5.6% |
| Immigrants | Guyana | 0.0 /100 | #311 | Tragic 5.6% |