Barbadian vs Immigrants from Germany Unemployment Among Women with Children Under 6 years
COMPARE
Barbadian
Immigrants from Germany
Unemployment Among Women with Children Under 6 years
Unemployment Among Women with Children Under 6 years Comparison
Barbadians
Immigrants from Germany
8.3%
UNEMPLOYMENT AMONG WOMEN WITH CHILDREN UNDER 6 YEARS
0.4/ 100
METRIC RATING
259th/ 347
METRIC RANK
7.9%
UNEMPLOYMENT AMONG WOMEN WITH CHILDREN UNDER 6 YEARS
8.5/ 100
METRIC RATING
221st/ 347
METRIC RANK
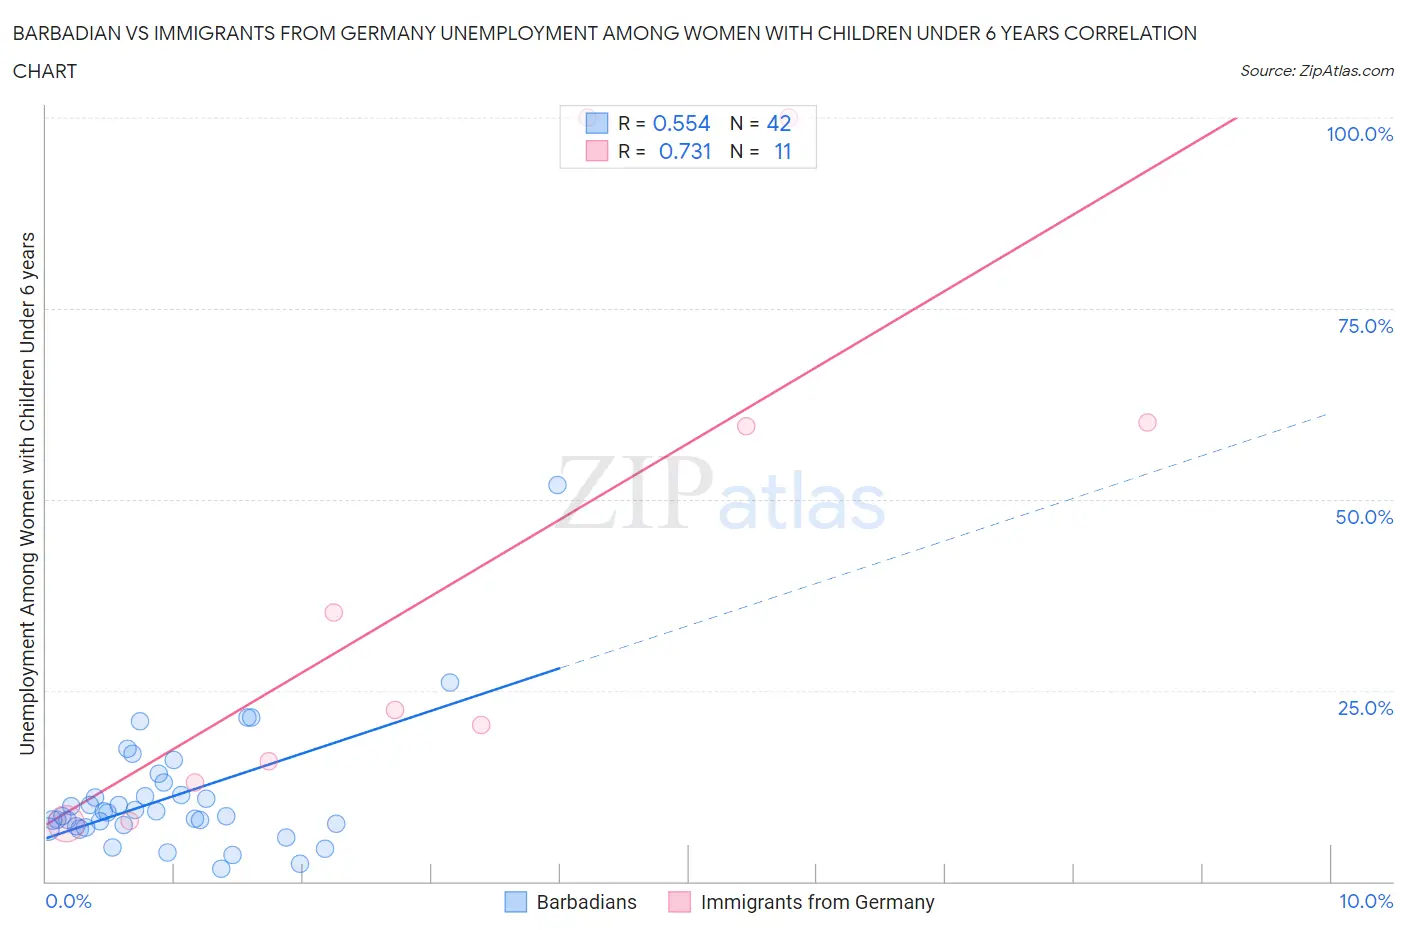
Barbadian vs Immigrants from Germany Unemployment Among Women with Children Under 6 years Correlation Chart
The statistical analysis conducted on geographies consisting of 125,746,302 people shows a substantial positive correlation between the proportion of Barbadians and unemployment rate among women with children under the age of 6 in the United States with a correlation coefficient (R) of 0.554 and weighted average of 8.3%. Similarly, the statistical analysis conducted on geographies consisting of 335,343,669 people shows a strong positive correlation between the proportion of Immigrants from Germany and unemployment rate among women with children under the age of 6 in the United States with a correlation coefficient (R) of 0.731 and weighted average of 7.9%, a difference of 5.0%.
Unemployment Among Women with Children Under 6 years Correlation Summary
| Measurement | Barbadian | Immigrants from Germany |
| Minimum | 1.6% | 7.6% |
| Maximum | 51.9% | 100.0% |
| Range | 50.3% | 92.4% |
| Mean | 11.0% | 40.2% |
| Median | 8.8% | 22.4% |
| Interquartile 25% (IQ1) | 7.3% | 12.9% |
| Interquartile 75% (IQ3) | 11.3% | 60.0% |
| Interquartile Range (IQR) | 4.0% | 47.1% |
| Standard Deviation (Sample) | 8.4% | 34.8% |
| Standard Deviation (Population) | 8.3% | 33.2% |
Similar Demographics by Unemployment Among Women with Children Under 6 years
Demographics Similar to Barbadians by Unemployment Among Women with Children Under 6 years
In terms of unemployment among women with children under 6 years, the demographic groups most similar to Barbadians are White/Caucasian (8.4%, a difference of 0.26%), Immigrants from Ghana (8.3%, a difference of 0.29%), British West Indian (8.3%, a difference of 0.31%), Immigrants from Liberia (8.4%, a difference of 0.54%), and West Indian (8.4%, a difference of 0.55%).
| Demographics | Rating | Rank | Unemployment Among Women with Children Under 6 years |
| Ghanaians | 1.0 /100 | #252 | Tragic 8.2% |
| Immigrants | Guyana | 0.8 /100 | #253 | Tragic 8.2% |
| Immigrants | Caribbean | 0.7 /100 | #254 | Tragic 8.3% |
| Immigrants | Portugal | 0.6 /100 | #255 | Tragic 8.3% |
| Celtics | 0.6 /100 | #256 | Tragic 8.3% |
| British West Indians | 0.5 /100 | #257 | Tragic 8.3% |
| Immigrants | Ghana | 0.5 /100 | #258 | Tragic 8.3% |
| Barbadians | 0.4 /100 | #259 | Tragic 8.3% |
| Whites/Caucasians | 0.3 /100 | #260 | Tragic 8.4% |
| Immigrants | Liberia | 0.3 /100 | #261 | Tragic 8.4% |
| West Indians | 0.3 /100 | #262 | Tragic 8.4% |
| Scotch-Irish | 0.3 /100 | #263 | Tragic 8.4% |
| Hondurans | 0.3 /100 | #264 | Tragic 8.4% |
| French Canadians | 0.3 /100 | #265 | Tragic 8.4% |
| Immigrants | Honduras | 0.3 /100 | #266 | Tragic 8.4% |
Demographics Similar to Immigrants from Germany by Unemployment Among Women with Children Under 6 years
In terms of unemployment among women with children under 6 years, the demographic groups most similar to Immigrants from Germany are Samoan (7.9%, a difference of 0.020%), Carpatho Rusyn (8.0%, a difference of 0.15%), South American Indian (7.9%, a difference of 0.16%), Arab (7.9%, a difference of 0.17%), and Moroccan (7.9%, a difference of 0.25%).
| Demographics | Rating | Rank | Unemployment Among Women with Children Under 6 years |
| Spanish | 11.3 /100 | #214 | Poor 7.9% |
| Ecuadorians | 11.2 /100 | #215 | Poor 7.9% |
| Immigrants | Lebanon | 11.1 /100 | #216 | Poor 7.9% |
| Immigrants | Nigeria | 10.3 /100 | #217 | Poor 7.9% |
| Moroccans | 9.7 /100 | #218 | Tragic 7.9% |
| Arabs | 9.4 /100 | #219 | Tragic 7.9% |
| South American Indians | 9.3 /100 | #220 | Tragic 7.9% |
| Immigrants | Germany | 8.5 /100 | #221 | Tragic 7.9% |
| Samoans | 8.4 /100 | #222 | Tragic 7.9% |
| Carpatho Rusyns | 7.8 /100 | #223 | Tragic 8.0% |
| English | 7.2 /100 | #224 | Tragic 8.0% |
| Germans | 7.0 /100 | #225 | Tragic 8.0% |
| Senegalese | 6.2 /100 | #226 | Tragic 8.0% |
| Portuguese | 6.2 /100 | #227 | Tragic 8.0% |
| Immigrants | Sudan | 6.0 /100 | #228 | Tragic 8.0% |