Bermudan vs Slovak Male Unemployment
COMPARE
Bermudan
Slovak
Male Unemployment
Male Unemployment Comparison
Bermudans
Slovaks
5.9%
MALE UNEMPLOYMENT
0.0/ 100
METRIC RATING
268th/ 347
METRIC RANK
5.2%
MALE UNEMPLOYMENT
75.5/ 100
METRIC RATING
151st/ 347
METRIC RANK
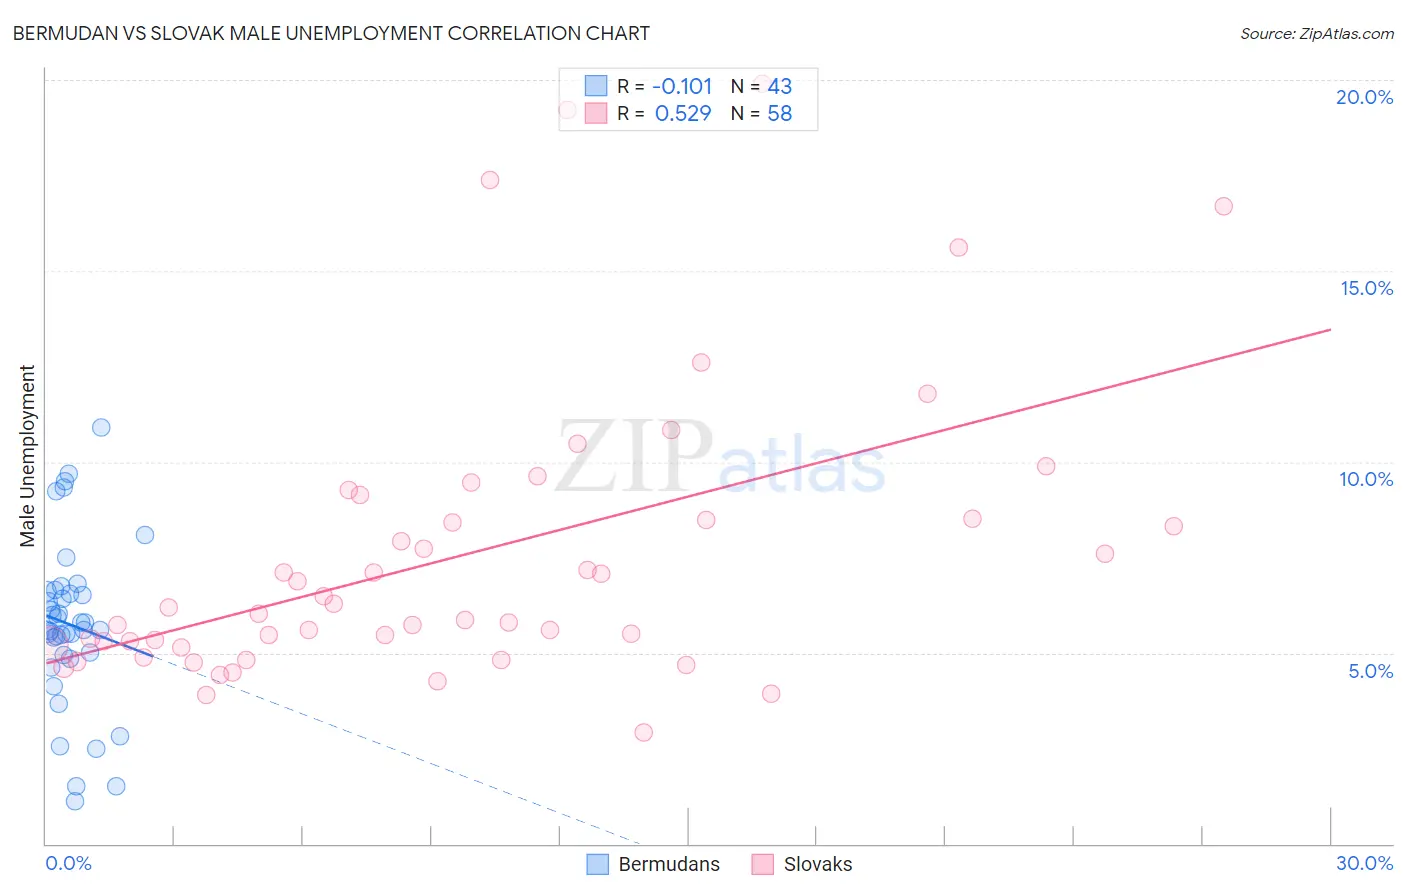
Bermudan vs Slovak Male Unemployment Correlation Chart
The statistical analysis conducted on geographies consisting of 55,661,801 people shows a poor negative correlation between the proportion of Bermudans and unemployment rate among males in the United States with a correlation coefficient (R) of -0.101 and weighted average of 5.9%. Similarly, the statistical analysis conducted on geographies consisting of 395,477,996 people shows a substantial positive correlation between the proportion of Slovaks and unemployment rate among males in the United States with a correlation coefficient (R) of 0.529 and weighted average of 5.2%, a difference of 14.0%.
Male Unemployment Correlation Summary
| Measurement | Bermudan | Slovak |
| Minimum | 1.1% | 2.9% |
| Maximum | 10.9% | 19.9% |
| Range | 9.8% | 17.0% |
| Mean | 5.7% | 7.6% |
| Median | 5.6% | 6.1% |
| Interquartile 25% (IQ1) | 4.9% | 5.2% |
| Interquartile 75% (IQ3) | 6.6% | 8.5% |
| Interquartile Range (IQR) | 1.7% | 3.3% |
| Standard Deviation (Sample) | 2.1% | 3.8% |
| Standard Deviation (Population) | 2.1% | 3.8% |
Similar Demographics by Male Unemployment
Demographics Similar to Bermudans by Male Unemployment
In terms of male unemployment, the demographic groups most similar to Bermudans are Nigerian (5.9%, a difference of 0.21%), Immigrants from Nigeria (6.0%, a difference of 0.27%), Bahamian (5.9%, a difference of 0.33%), Subsaharan African (6.0%, a difference of 0.40%), and French American Indian (5.9%, a difference of 0.47%).
| Demographics | Rating | Rank | Male Unemployment |
| Liberians | 0.1 /100 | #261 | Tragic 5.8% |
| Immigrants | Portugal | 0.1 /100 | #262 | Tragic 5.9% |
| Immigrants | Latin America | 0.1 /100 | #263 | Tragic 5.9% |
| Immigrants | Mexico | 0.0 /100 | #264 | Tragic 5.9% |
| French American Indians | 0.0 /100 | #265 | Tragic 5.9% |
| Bahamians | 0.0 /100 | #266 | Tragic 5.9% |
| Nigerians | 0.0 /100 | #267 | Tragic 5.9% |
| Bermudans | 0.0 /100 | #268 | Tragic 5.9% |
| Immigrants | Nigeria | 0.0 /100 | #269 | Tragic 6.0% |
| Sub-Saharan Africans | 0.0 /100 | #270 | Tragic 6.0% |
| Blackfeet | 0.0 /100 | #271 | Tragic 6.0% |
| Immigrants | Uzbekistan | 0.0 /100 | #272 | Tragic 6.0% |
| Armenians | 0.0 /100 | #273 | Tragic 6.0% |
| Immigrants | Sierra Leone | 0.0 /100 | #274 | Tragic 6.0% |
| Menominee | 0.0 /100 | #275 | Tragic 6.0% |
Demographics Similar to Slovaks by Male Unemployment
In terms of male unemployment, the demographic groups most similar to Slovaks are Indian (Asian) (5.2%, a difference of 0.040%), Egyptian (5.2%, a difference of 0.050%), Immigrants from Italy (5.2%, a difference of 0.060%), Immigrants from Europe (5.2%, a difference of 0.060%), and Immigrants from Uruguay (5.2%, a difference of 0.13%).
| Demographics | Rating | Rank | Male Unemployment |
| Sri Lankans | 77.9 /100 | #144 | Good 5.2% |
| Macedonians | 77.7 /100 | #145 | Good 5.2% |
| Immigrants | Kenya | 77.6 /100 | #146 | Good 5.2% |
| Immigrants | Burma/Myanmar | 77.5 /100 | #147 | Good 5.2% |
| Immigrants | Italy | 76.3 /100 | #148 | Good 5.2% |
| Immigrants | Europe | 76.2 /100 | #149 | Good 5.2% |
| Indians (Asian) | 76.0 /100 | #150 | Good 5.2% |
| Slovaks | 75.5 /100 | #151 | Good 5.2% |
| Egyptians | 74.8 /100 | #152 | Good 5.2% |
| Immigrants | Uruguay | 73.9 /100 | #153 | Good 5.2% |
| Laotians | 73.8 /100 | #154 | Good 5.2% |
| Immigrants | Hungary | 73.4 /100 | #155 | Good 5.2% |
| Americans | 72.7 /100 | #156 | Good 5.2% |
| Immigrants | Northern Africa | 72.3 /100 | #157 | Good 5.2% |
| Immigrants | Indonesia | 71.5 /100 | #158 | Good 5.2% |