Brazilian vs Immigrants from Micronesia Unemployment Among Ages 55 to 59 years
COMPARE
Brazilian
Immigrants from Micronesia
Unemployment Among Ages 55 to 59 years
Unemployment Among Ages 55 to 59 years Comparison
Brazilians
Immigrants from Micronesia
5.0%
UNEMPLOYMENT AMONG AGES 55 TO 59 YEARS
1.0/ 100
METRIC RATING
241st/ 347
METRIC RANK
4.6%
UNEMPLOYMENT AMONG AGES 55 TO 59 YEARS
99.0/ 100
METRIC RATING
68th/ 347
METRIC RANK
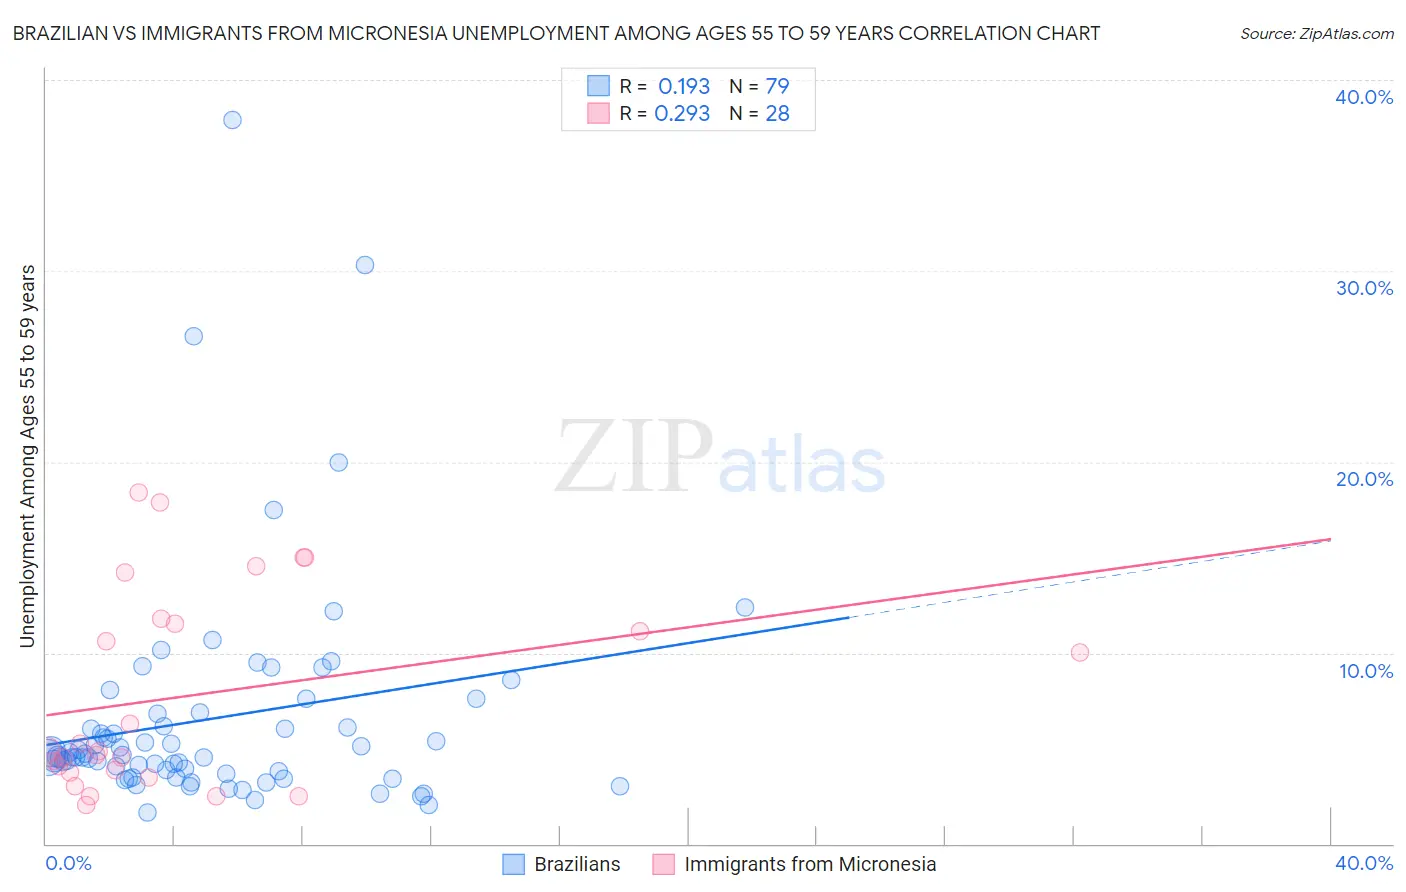
Brazilian vs Immigrants from Micronesia Unemployment Among Ages 55 to 59 years Correlation Chart
The statistical analysis conducted on geographies consisting of 306,202,810 people shows a poor positive correlation between the proportion of Brazilians and unemployment rate among population between the ages 55 and 59 in the United States with a correlation coefficient (R) of 0.193 and weighted average of 5.0%. Similarly, the statistical analysis conducted on geographies consisting of 60,117,162 people shows a weak positive correlation between the proportion of Immigrants from Micronesia and unemployment rate among population between the ages 55 and 59 in the United States with a correlation coefficient (R) of 0.293 and weighted average of 4.6%, a difference of 9.7%.
Unemployment Among Ages 55 to 59 years Correlation Summary
| Measurement | Brazilian | Immigrants from Micronesia |
| Minimum | 1.6% | 2.1% |
| Maximum | 37.9% | 18.4% |
| Range | 36.3% | 16.3% |
| Mean | 6.5% | 7.8% |
| Median | 4.6% | 4.9% |
| Interquartile 25% (IQ1) | 3.7% | 3.8% |
| Interquartile 75% (IQ3) | 6.8% | 11.6% |
| Interquartile Range (IQR) | 3.2% | 7.8% |
| Standard Deviation (Sample) | 6.0% | 5.2% |
| Standard Deviation (Population) | 5.9% | 5.1% |
Similar Demographics by Unemployment Among Ages 55 to 59 years
Demographics Similar to Brazilians by Unemployment Among Ages 55 to 59 years
In terms of unemployment among ages 55 to 59 years, the demographic groups most similar to Brazilians are Immigrants from Costa Rica (5.0%, a difference of 0.040%), French American Indian (5.0%, a difference of 0.17%), Moroccan (5.0%, a difference of 0.18%), Liberian (5.1%, a difference of 0.18%), and Choctaw (5.0%, a difference of 0.20%).
| Demographics | Rating | Rank | Unemployment Among Ages 55 to 59 years |
| Immigrants | Southern Europe | 1.8 /100 | #234 | Tragic 5.0% |
| Immigrants | Hong Kong | 1.4 /100 | #235 | Tragic 5.0% |
| Immigrants | Albania | 1.3 /100 | #236 | Tragic 5.0% |
| Choctaw | 1.3 /100 | #237 | Tragic 5.0% |
| Moroccans | 1.3 /100 | #238 | Tragic 5.0% |
| French American Indians | 1.2 /100 | #239 | Tragic 5.0% |
| Immigrants | Costa Rica | 1.1 /100 | #240 | Tragic 5.0% |
| Brazilians | 1.0 /100 | #241 | Tragic 5.0% |
| Liberians | 0.9 /100 | #242 | Tragic 5.1% |
| Hondurans | 0.7 /100 | #243 | Tragic 5.1% |
| Immigrants | Fiji | 0.7 /100 | #244 | Tragic 5.1% |
| Soviet Union | 0.6 /100 | #245 | Tragic 5.1% |
| Immigrants | Greece | 0.6 /100 | #246 | Tragic 5.1% |
| Immigrants | Honduras | 0.5 /100 | #247 | Tragic 5.1% |
| Native Hawaiians | 0.5 /100 | #248 | Tragic 5.1% |
Demographics Similar to Immigrants from Micronesia by Unemployment Among Ages 55 to 59 years
In terms of unemployment among ages 55 to 59 years, the demographic groups most similar to Immigrants from Micronesia are Ugandan (4.6%, a difference of 0.010%), Czechoslovakian (4.6%, a difference of 0.010%), Mongolian (4.6%, a difference of 0.050%), Sudanese (4.6%, a difference of 0.18%), and Argentinean (4.6%, a difference of 0.19%).
| Demographics | Rating | Rank | Unemployment Among Ages 55 to 59 years |
| Immigrants | Argentina | 99.5 /100 | #61 | Exceptional 4.6% |
| Slovenes | 99.3 /100 | #62 | Exceptional 4.6% |
| Immigrants | South Central Asia | 99.3 /100 | #63 | Exceptional 4.6% |
| Argentineans | 99.1 /100 | #64 | Exceptional 4.6% |
| Sudanese | 99.1 /100 | #65 | Exceptional 4.6% |
| Mongolians | 99.0 /100 | #66 | Exceptional 4.6% |
| Ugandans | 99.0 /100 | #67 | Exceptional 4.6% |
| Immigrants | Micronesia | 99.0 /100 | #68 | Exceptional 4.6% |
| Czechoslovakians | 99.0 /100 | #69 | Exceptional 4.6% |
| Filipinos | 98.8 /100 | #70 | Exceptional 4.6% |
| Immigrants | Jordan | 98.7 /100 | #71 | Exceptional 4.6% |
| Immigrants | Taiwan | 98.7 /100 | #72 | Exceptional 4.6% |
| Bhutanese | 98.6 /100 | #73 | Exceptional 4.6% |
| Croatians | 98.5 /100 | #74 | Exceptional 4.6% |
| Immigrants | Iraq | 98.5 /100 | #75 | Exceptional 4.6% |