British West Indian vs Slovak Unemployment Among Women with Children Ages 6 to 17 years
COMPARE
British West Indian
Slovak
Unemployment Among Women with Children Ages 6 to 17 years
Unemployment Among Women with Children Ages 6 to 17 years Comparison
British West Indians
Slovaks
9.7%
UNEMPLOYMENT AMONG WOMEN WITH CHILDREN AGES 6 TO 17 YEARS
0.1/ 100
METRIC RATING
277th/ 347
METRIC RANK
9.8%
UNEMPLOYMENT AMONG WOMEN WITH CHILDREN AGES 6 TO 17 YEARS
0.0/ 100
METRIC RATING
282nd/ 347
METRIC RANK
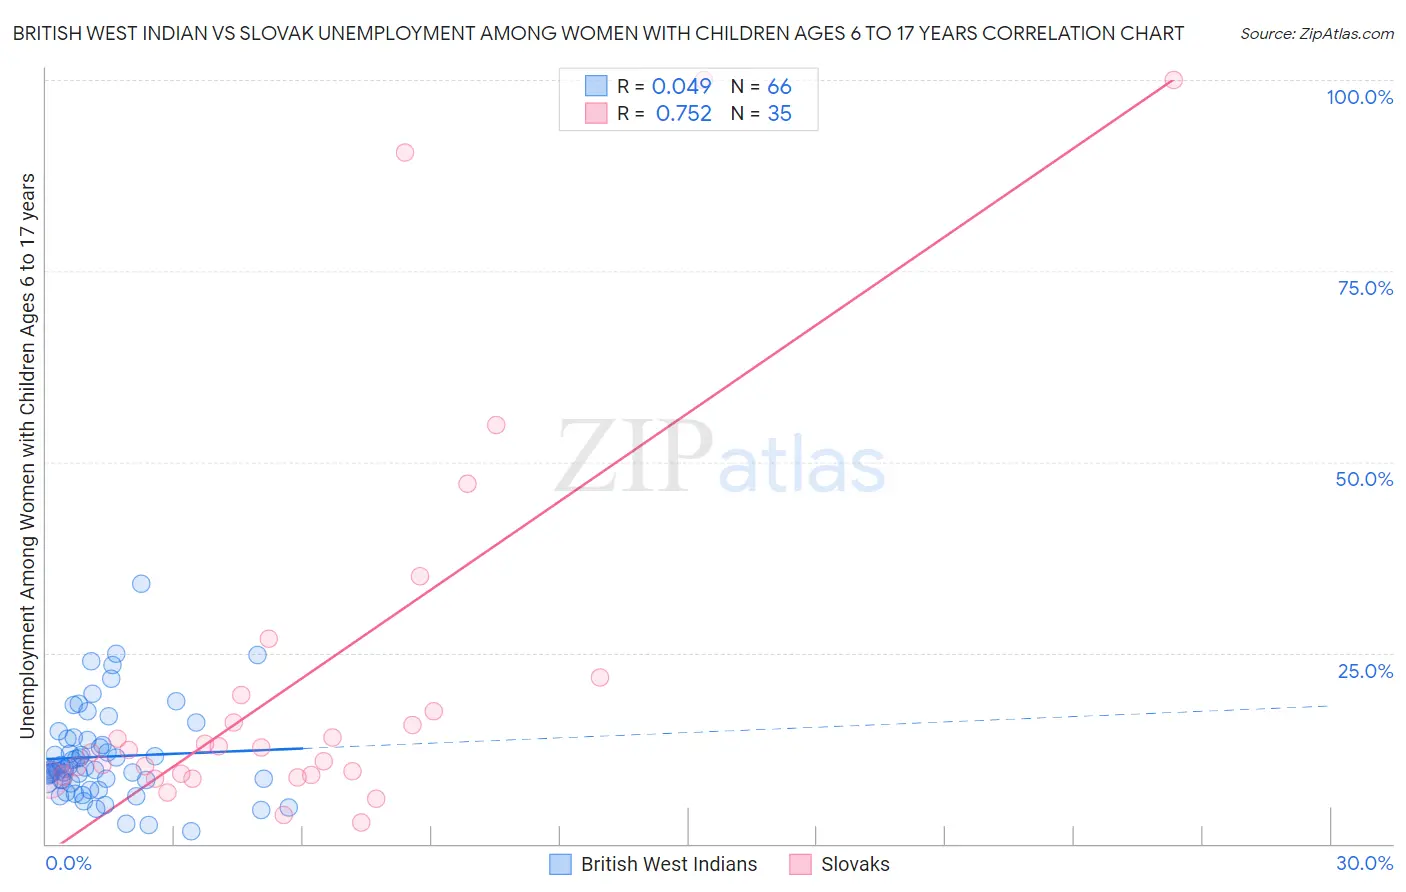
British West Indian vs Slovak Unemployment Among Women with Children Ages 6 to 17 years Correlation Chart
The statistical analysis conducted on geographies consisting of 128,120,718 people shows no correlation between the proportion of British West Indians and unemployment rate among women with children between the ages 6 and 17 in the United States with a correlation coefficient (R) of 0.049 and weighted average of 9.7%. Similarly, the statistical analysis conducted on geographies consisting of 272,612,741 people shows a strong positive correlation between the proportion of Slovaks and unemployment rate among women with children between the ages 6 and 17 in the United States with a correlation coefficient (R) of 0.752 and weighted average of 9.8%, a difference of 1.1%.
Unemployment Among Women with Children Ages 6 to 17 years Correlation Summary
| Measurement | British West Indian | Slovak |
| Minimum | 1.6% | 2.7% |
| Maximum | 34.1% | 100.0% |
| Range | 32.5% | 97.3% |
| Mean | 11.4% | 21.9% |
| Median | 9.9% | 12.3% |
| Interquartile 25% (IQ1) | 8.2% | 8.9% |
| Interquartile 75% (IQ3) | 13.5% | 19.5% |
| Interquartile Range (IQR) | 5.4% | 10.5% |
| Standard Deviation (Sample) | 6.0% | 25.8% |
| Standard Deviation (Population) | 6.0% | 25.4% |
Demographics Similar to British West Indians and Slovaks by Unemployment Among Women with Children Ages 6 to 17 years
In terms of unemployment among women with children ages 6 to 17 years, the demographic groups most similar to British West Indians are Immigrants from Portugal (9.7%, a difference of 0.050%), U.S. Virgin Islander (9.7%, a difference of 0.060%), French (9.7%, a difference of 0.070%), Scotch-Irish (9.7%, a difference of 0.11%), and Seminole (9.7%, a difference of 0.29%). Similarly, the demographic groups most similar to Slovaks are Jamaican (9.8%, a difference of 0.23%), Seminole (9.7%, a difference of 0.76%), Central American Indian (9.9%, a difference of 0.83%), Scotch-Irish (9.7%, a difference of 0.95%), and Yakama (9.9%, a difference of 0.98%).
| Demographics | Rating | Rank | Unemployment Among Women with Children Ages 6 to 17 years |
| Blackfeet | 0.2 /100 | #269 | Tragic 9.6% |
| Immigrants | Nicaragua | 0.2 /100 | #270 | Tragic 9.6% |
| Immigrants | Latin America | 0.1 /100 | #271 | Tragic 9.6% |
| Kiowa | 0.1 /100 | #272 | Tragic 9.6% |
| Whites/Caucasians | 0.1 /100 | #273 | Tragic 9.6% |
| Aleuts | 0.1 /100 | #274 | Tragic 9.6% |
| U.S. Virgin Islanders | 0.1 /100 | #275 | Tragic 9.7% |
| Immigrants | Portugal | 0.1 /100 | #276 | Tragic 9.7% |
| British West Indians | 0.1 /100 | #277 | Tragic 9.7% |
| French | 0.1 /100 | #278 | Tragic 9.7% |
| Scotch-Irish | 0.1 /100 | #279 | Tragic 9.7% |
| Seminole | 0.1 /100 | #280 | Tragic 9.7% |
| Jamaicans | 0.0 /100 | #281 | Tragic 9.8% |
| Slovaks | 0.0 /100 | #282 | Tragic 9.8% |
| Central American Indians | 0.0 /100 | #283 | Tragic 9.9% |
| Yakama | 0.0 /100 | #284 | Tragic 9.9% |
| Hispanics or Latinos | 0.0 /100 | #285 | Tragic 9.9% |
| Choctaw | 0.0 /100 | #286 | Tragic 9.9% |
| Sierra Leoneans | 0.0 /100 | #287 | Tragic 9.9% |
| Shoshone | 0.0 /100 | #288 | Tragic 10.0% |
| Hondurans | 0.0 /100 | #289 | Tragic 10.0% |