Cajun vs Japanese Unemployment Among Ages 30 to 34 years
COMPARE
Cajun
Japanese
Unemployment Among Ages 30 to 34 years
Unemployment Among Ages 30 to 34 years Comparison
Cajuns
Japanese
6.7%
UNEMPLOYMENT AMONG AGES 30 TO 34 YEARS
0.0/ 100
METRIC RATING
303rd/ 347
METRIC RANK
5.9%
UNEMPLOYMENT AMONG AGES 30 TO 34 YEARS
1.1/ 100
METRIC RATING
231st/ 347
METRIC RANK
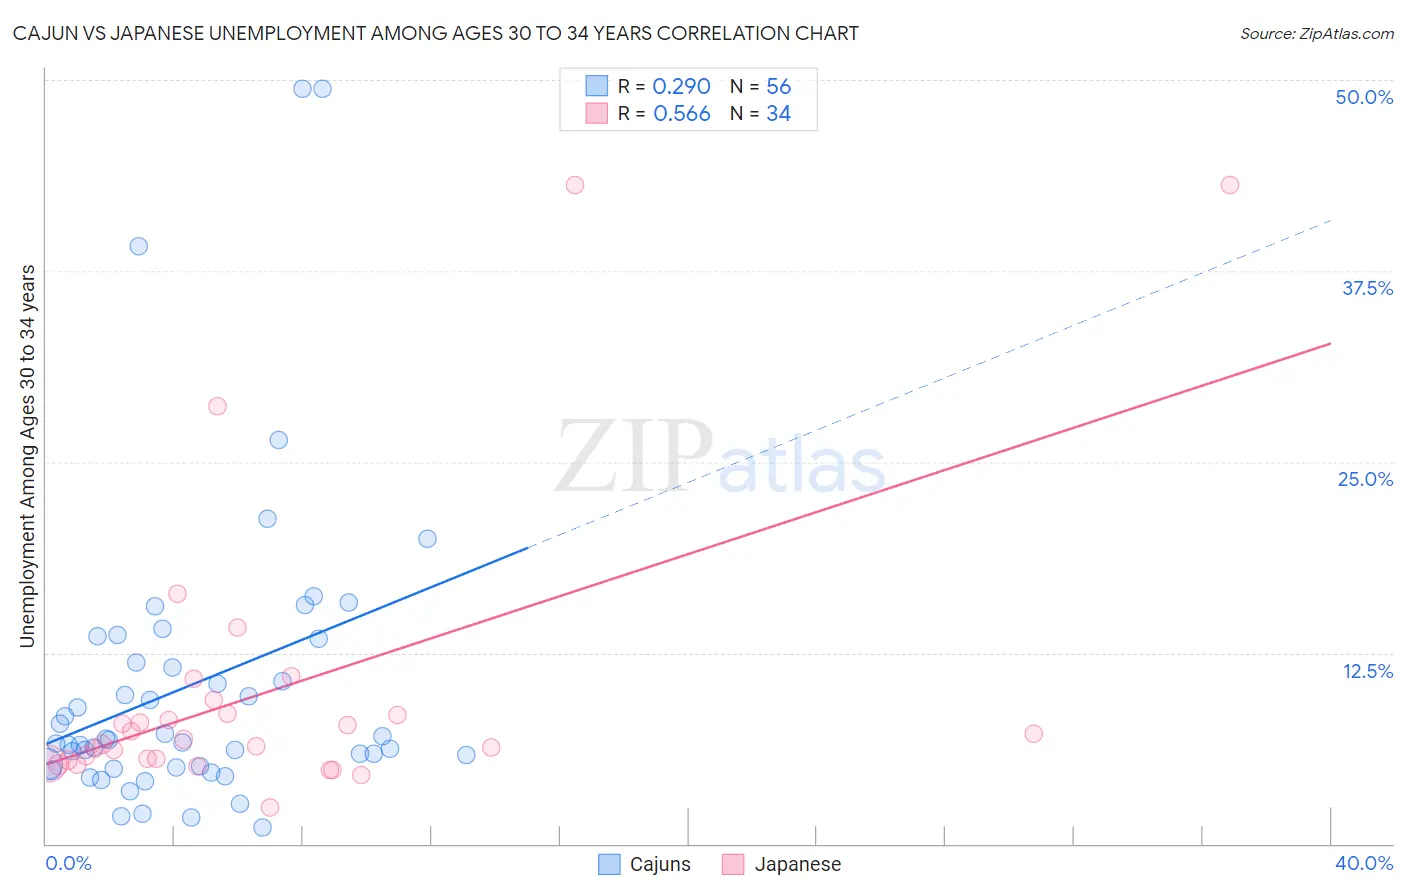
Cajun vs Japanese Unemployment Among Ages 30 to 34 years Correlation Chart
The statistical analysis conducted on geographies consisting of 144,402,531 people shows a weak positive correlation between the proportion of Cajuns and unemployment rate among population between the ages 30 and 34 in the United States with a correlation coefficient (R) of 0.290 and weighted average of 6.7%. Similarly, the statistical analysis conducted on geographies consisting of 242,582,466 people shows a substantial positive correlation between the proportion of Japanese and unemployment rate among population between the ages 30 and 34 in the United States with a correlation coefficient (R) of 0.566 and weighted average of 5.9%, a difference of 13.3%.
Unemployment Among Ages 30 to 34 years Correlation Summary
| Measurement | Cajun | Japanese |
| Minimum | 1.1% | 2.4% |
| Maximum | 49.4% | 43.1% |
| Range | 48.3% | 40.7% |
| Mean | 10.4% | 9.9% |
| Median | 6.7% | 6.7% |
| Interquartile 25% (IQ1) | 5.0% | 5.5% |
| Interquartile 75% (IQ3) | 12.6% | 8.5% |
| Interquartile Range (IQR) | 7.6% | 3.0% |
| Standard Deviation (Sample) | 10.0% | 9.6% |
| Standard Deviation (Population) | 9.9% | 9.4% |
Similar Demographics by Unemployment Among Ages 30 to 34 years
Demographics Similar to Cajuns by Unemployment Among Ages 30 to 34 years
In terms of unemployment among ages 30 to 34 years, the demographic groups most similar to Cajuns are Delaware (6.7%, a difference of 0.19%), Kiowa (6.7%, a difference of 0.42%), Paiute (6.7%, a difference of 0.46%), Belizean (6.6%, a difference of 1.0%), and Bahamian (6.6%, a difference of 1.3%).
| Demographics | Rating | Rank | Unemployment Among Ages 30 to 34 years |
| Immigrants | Jamaica | 0.0 /100 | #296 | Tragic 6.5% |
| Creek | 0.0 /100 | #297 | Tragic 6.6% |
| Immigrants | Barbados | 0.0 /100 | #298 | Tragic 6.6% |
| Dutch West Indians | 0.0 /100 | #299 | Tragic 6.6% |
| Bahamians | 0.0 /100 | #300 | Tragic 6.6% |
| Belizeans | 0.0 /100 | #301 | Tragic 6.6% |
| Delaware | 0.0 /100 | #302 | Tragic 6.7% |
| Cajuns | 0.0 /100 | #303 | Tragic 6.7% |
| Kiowa | 0.0 /100 | #304 | Tragic 6.7% |
| Paiute | 0.0 /100 | #305 | Tragic 6.7% |
| Immigrants | Armenia | 0.0 /100 | #306 | Tragic 6.8% |
| Immigrants | Belize | 0.0 /100 | #307 | Tragic 6.9% |
| Immigrants | Azores | 0.0 /100 | #308 | Tragic 6.9% |
| Immigrants | Grenada | 0.0 /100 | #309 | Tragic 6.9% |
| Immigrants | St. Vincent and the Grenadines | 0.0 /100 | #310 | Tragic 7.0% |
Demographics Similar to Japanese by Unemployment Among Ages 30 to 34 years
In terms of unemployment among ages 30 to 34 years, the demographic groups most similar to Japanese are Hawaiian (5.9%, a difference of 0.13%), Iroquois (5.9%, a difference of 0.13%), Immigrants from Uzbekistan (5.9%, a difference of 0.45%), Nepalese (5.9%, a difference of 0.51%), and Portuguese (5.9%, a difference of 0.54%).
| Demographics | Rating | Rank | Unemployment Among Ages 30 to 34 years |
| Slovaks | 2.5 /100 | #224 | Tragic 5.8% |
| Samoans | 2.5 /100 | #225 | Tragic 5.8% |
| Liberians | 2.3 /100 | #226 | Tragic 5.8% |
| Spanish | 1.8 /100 | #227 | Tragic 5.8% |
| Immigrants | Bahamas | 1.8 /100 | #228 | Tragic 5.8% |
| Immigrants | Uzbekistan | 1.5 /100 | #229 | Tragic 5.9% |
| Hawaiians | 1.2 /100 | #230 | Tragic 5.9% |
| Japanese | 1.1 /100 | #231 | Tragic 5.9% |
| Iroquois | 1.0 /100 | #232 | Tragic 5.9% |
| Nepalese | 0.8 /100 | #233 | Tragic 5.9% |
| Portuguese | 0.8 /100 | #234 | Tragic 5.9% |
| Yaqui | 0.7 /100 | #235 | Tragic 5.9% |
| Native Hawaiians | 0.7 /100 | #236 | Tragic 5.9% |
| Central Americans | 0.6 /100 | #237 | Tragic 5.9% |
| Mexican American Indians | 0.6 /100 | #238 | Tragic 5.9% |