Cape Verdean vs Creek Male Unemployment
COMPARE
Cape Verdean
Creek
Male Unemployment
Male Unemployment Comparison
Cape Verdeans
Creek
7.1%
MALE UNEMPLOYMENT
0.0/ 100
METRIC RATING
318th/ 347
METRIC RANK
5.6%
MALE UNEMPLOYMENT
2.6/ 100
METRIC RATING
223rd/ 347
METRIC RANK
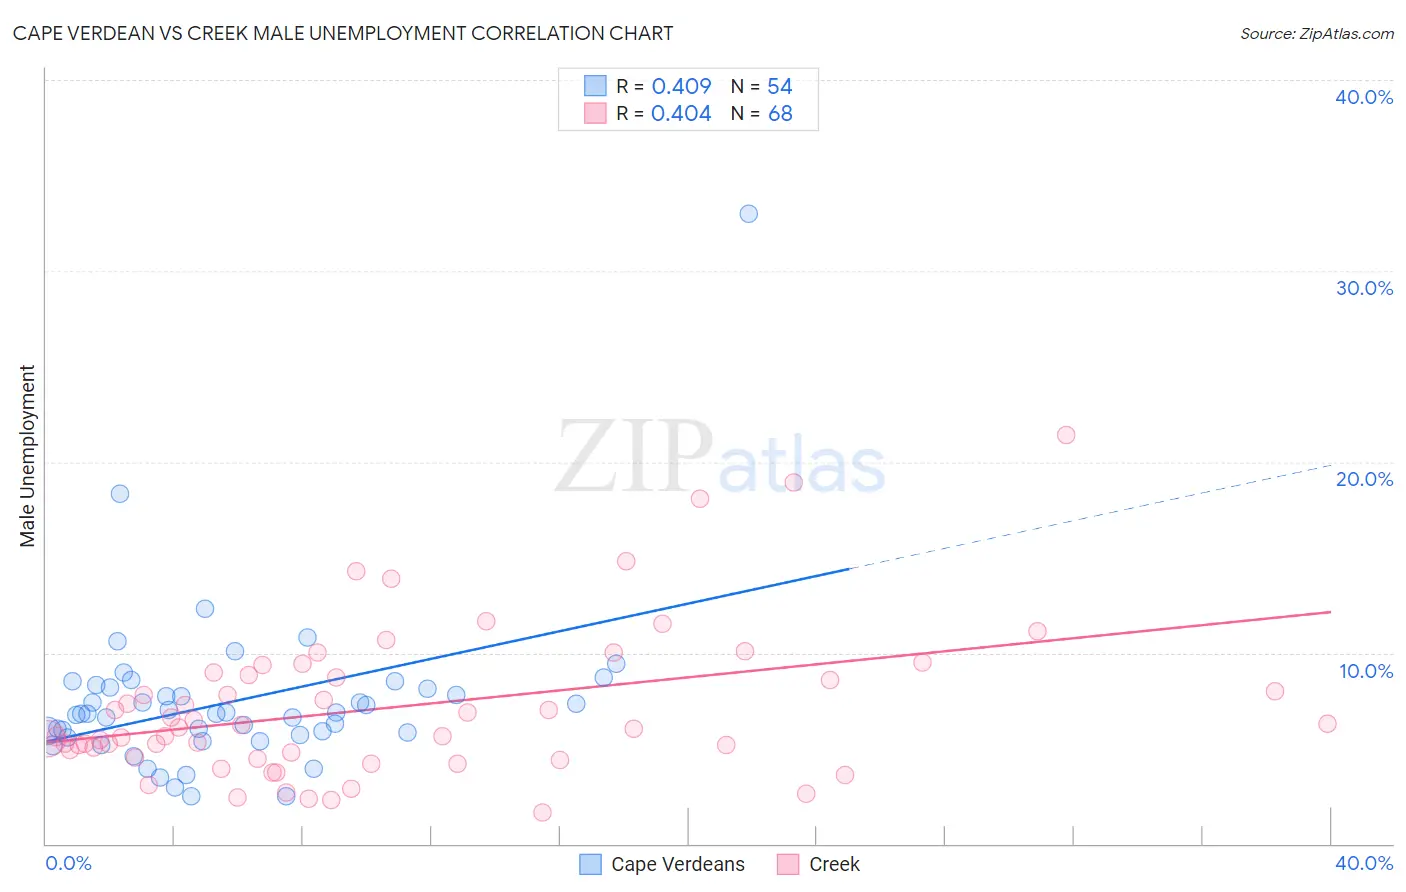
Cape Verdean vs Creek Male Unemployment Correlation Chart
The statistical analysis conducted on geographies consisting of 107,471,642 people shows a moderate positive correlation between the proportion of Cape Verdeans and unemployment rate among males in the United States with a correlation coefficient (R) of 0.409 and weighted average of 7.1%. Similarly, the statistical analysis conducted on geographies consisting of 177,831,732 people shows a moderate positive correlation between the proportion of Creek and unemployment rate among males in the United States with a correlation coefficient (R) of 0.404 and weighted average of 5.6%, a difference of 27.7%.
Male Unemployment Correlation Summary
| Measurement | Cape Verdean | Creek |
| Minimum | 2.5% | 1.6% |
| Maximum | 33.0% | 21.4% |
| Range | 30.5% | 19.8% |
| Mean | 7.4% | 7.1% |
| Median | 6.8% | 6.1% |
| Interquartile 25% (IQ1) | 5.7% | 4.7% |
| Interquartile 75% (IQ3) | 8.2% | 8.9% |
| Interquartile Range (IQR) | 2.5% | 4.3% |
| Standard Deviation (Sample) | 4.4% | 4.0% |
| Standard Deviation (Population) | 4.3% | 3.9% |
Similar Demographics by Male Unemployment
Demographics Similar to Cape Verdeans by Male Unemployment
In terms of male unemployment, the demographic groups most similar to Cape Verdeans are Guyanese (7.1%, a difference of 0.070%), Immigrants from Guyana (7.1%, a difference of 0.12%), Houma (7.1%, a difference of 0.15%), Immigrants from Barbados (7.1%, a difference of 0.36%), and Immigrants from Dominica (7.0%, a difference of 1.6%).
| Demographics | Rating | Rank | Male Unemployment |
| Immigrants | Armenia | 0.0 /100 | #311 | Tragic 6.9% |
| Lumbee | 0.0 /100 | #312 | Tragic 6.9% |
| Immigrants | Dominica | 0.0 /100 | #313 | Tragic 7.0% |
| Immigrants | Barbados | 0.0 /100 | #314 | Tragic 7.1% |
| Houma | 0.0 /100 | #315 | Tragic 7.1% |
| Immigrants | Guyana | 0.0 /100 | #316 | Tragic 7.1% |
| Guyanese | 0.0 /100 | #317 | Tragic 7.1% |
| Cape Verdeans | 0.0 /100 | #318 | Tragic 7.1% |
| British West Indians | 0.0 /100 | #319 | Tragic 7.3% |
| Colville | 0.0 /100 | #320 | Tragic 7.4% |
| Immigrants | St. Vincent and the Grenadines | 0.0 /100 | #321 | Tragic 7.5% |
| Immigrants | Cabo Verde | 0.0 /100 | #322 | Tragic 7.5% |
| Immigrants | Grenada | 0.0 /100 | #323 | Tragic 7.6% |
| Dominicans | 0.0 /100 | #324 | Tragic 7.6% |
| Shoshone | 0.0 /100 | #325 | Tragic 7.6% |
Demographics Similar to Creek by Male Unemployment
In terms of male unemployment, the demographic groups most similar to Creek are Cherokee (5.6%, a difference of 0.13%), Immigrants from Micronesia (5.6%, a difference of 0.15%), Soviet Union (5.6%, a difference of 0.29%), Portuguese (5.6%, a difference of 0.40%), and Immigrants from Western Asia (5.6%, a difference of 0.42%).
| Demographics | Rating | Rank | Male Unemployment |
| Immigrants | Immigrants | 4.3 /100 | #216 | Tragic 5.5% |
| Delaware | 4.2 /100 | #217 | Tragic 5.5% |
| Immigrants | Albania | 3.6 /100 | #218 | Tragic 5.5% |
| Immigrants | Western Asia | 3.5 /100 | #219 | Tragic 5.6% |
| Portuguese | 3.5 /100 | #220 | Tragic 5.6% |
| Soviet Union | 3.2 /100 | #221 | Tragic 5.6% |
| Immigrants | Micronesia | 2.9 /100 | #222 | Tragic 5.6% |
| Creek | 2.6 /100 | #223 | Tragic 5.6% |
| Cherokee | 2.4 /100 | #224 | Tragic 5.6% |
| Panamanians | 1.9 /100 | #225 | Tragic 5.6% |
| Immigrants | Cambodia | 1.8 /100 | #226 | Tragic 5.6% |
| Immigrants | Panama | 1.8 /100 | #227 | Tragic 5.6% |
| Seminole | 1.8 /100 | #228 | Tragic 5.6% |
| Central Americans | 1.8 /100 | #229 | Tragic 5.6% |
| Immigrants | Africa | 1.7 /100 | #230 | Tragic 5.6% |