Carpatho Rusyn vs Immigrants from Bulgaria Female Unemployment
COMPARE
Carpatho Rusyn
Immigrants from Bulgaria
Female Unemployment
Female Unemployment Comparison
Carpatho Rusyns
Immigrants from Bulgaria
4.7%
FEMALE UNEMPLOYMENT
99.9/ 100
METRIC RATING
16th/ 347
METRIC RANK
4.9%
FEMALE UNEMPLOYMENT
99.3/ 100
METRIC RATING
46th/ 347
METRIC RANK
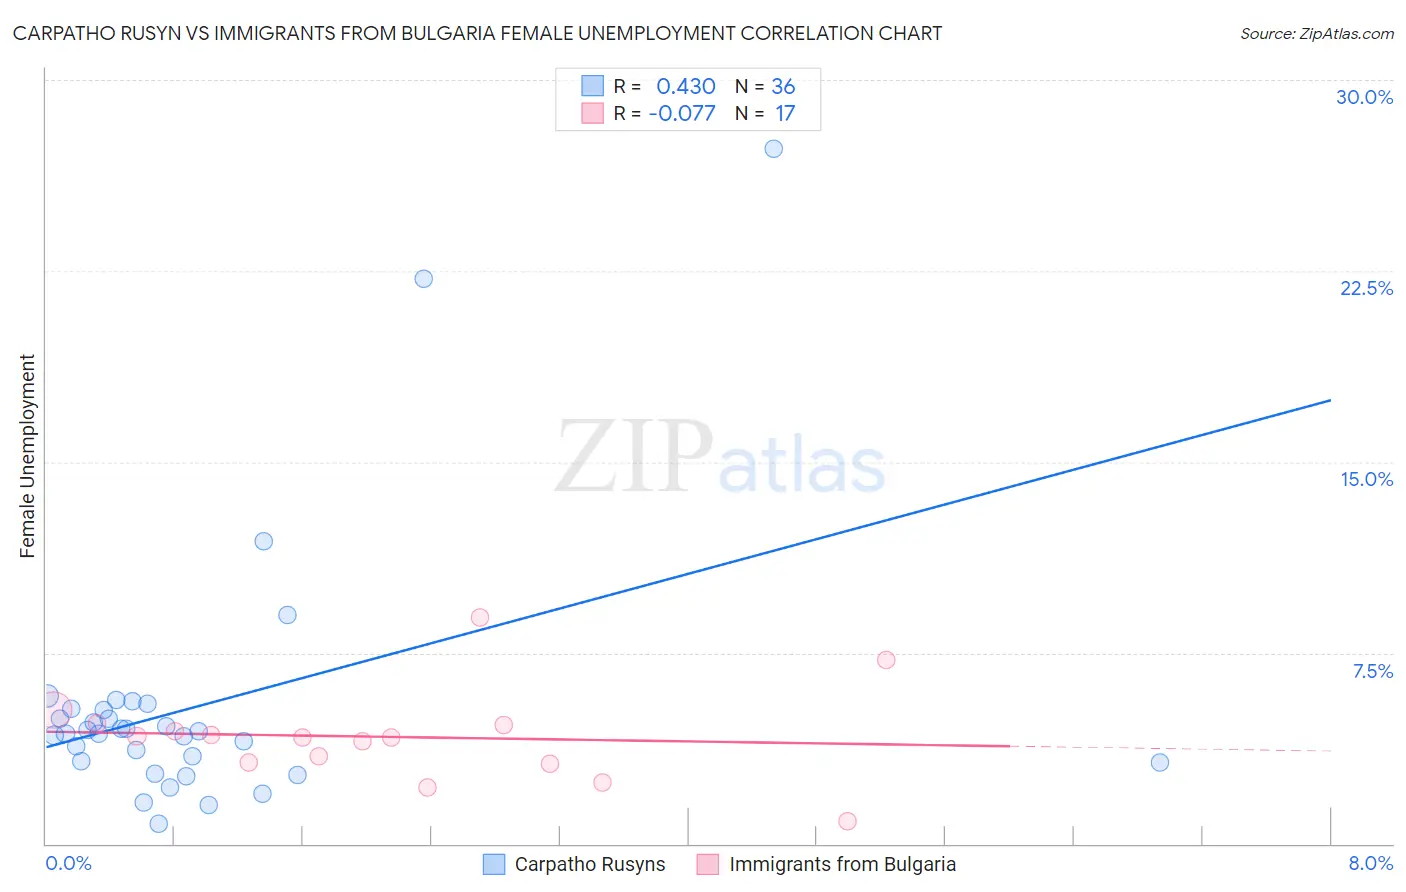
Carpatho Rusyn vs Immigrants from Bulgaria Female Unemployment Correlation Chart
The statistical analysis conducted on geographies consisting of 58,788,247 people shows a moderate positive correlation between the proportion of Carpatho Rusyns and unemploymnet rate among females in the United States with a correlation coefficient (R) of 0.430 and weighted average of 4.7%. Similarly, the statistical analysis conducted on geographies consisting of 172,394,252 people shows a slight negative correlation between the proportion of Immigrants from Bulgaria and unemploymnet rate among females in the United States with a correlation coefficient (R) of -0.077 and weighted average of 4.9%, a difference of 4.0%.
Female Unemployment Correlation Summary
| Measurement | Carpatho Rusyn | Immigrants from Bulgaria |
| Minimum | 0.80% | 0.90% |
| Maximum | 27.3% | 8.9% |
| Range | 26.5% | 8.0% |
| Mean | 5.4% | 4.2% |
| Median | 4.4% | 4.2% |
| Interquartile 25% (IQ1) | 3.2% | 3.2% |
| Interquartile 75% (IQ3) | 5.3% | 4.7% |
| Interquartile Range (IQR) | 2.1% | 1.5% |
| Standard Deviation (Sample) | 5.2% | 1.8% |
| Standard Deviation (Population) | 5.1% | 1.8% |
Similar Demographics by Female Unemployment
Demographics Similar to Carpatho Rusyns by Female Unemployment
In terms of female unemployment, the demographic groups most similar to Carpatho Rusyns are Croatian (4.7%, a difference of 0.020%), Latvian (4.7%, a difference of 0.16%), Polish (4.7%, a difference of 0.17%), Bulgarian (4.7%, a difference of 0.25%), and Fijian (4.7%, a difference of 0.27%).
| Demographics | Rating | Rank | Female Unemployment |
| Slovenes | 100.0 /100 | #9 | Exceptional 4.5% |
| Swiss | 100.0 /100 | #10 | Exceptional 4.6% |
| Scandinavians | 100.0 /100 | #11 | Exceptional 4.6% |
| Dutch | 100.0 /100 | #12 | Exceptional 4.6% |
| Belgians | 100.0 /100 | #13 | Exceptional 4.6% |
| Finns | 100.0 /100 | #14 | Exceptional 4.6% |
| English | 100.0 /100 | #15 | Exceptional 4.6% |
| Carpatho Rusyns | 99.9 /100 | #16 | Exceptional 4.7% |
| Croatians | 99.9 /100 | #17 | Exceptional 4.7% |
| Latvians | 99.9 /100 | #18 | Exceptional 4.7% |
| Poles | 99.9 /100 | #19 | Exceptional 4.7% |
| Bulgarians | 99.9 /100 | #20 | Exceptional 4.7% |
| Fijians | 99.9 /100 | #21 | Exceptional 4.7% |
| Europeans | 99.9 /100 | #22 | Exceptional 4.7% |
| Scottish | 99.9 /100 | #23 | Exceptional 4.7% |
Demographics Similar to Immigrants from Bulgaria by Female Unemployment
In terms of female unemployment, the demographic groups most similar to Immigrants from Bulgaria are Austrian (4.9%, a difference of 0.030%), Okinawan (4.9%, a difference of 0.080%), Greek (4.9%, a difference of 0.10%), Eastern European (4.9%, a difference of 0.21%), and Thai (4.9%, a difference of 0.29%).
| Demographics | Rating | Rank | Female Unemployment |
| Scotch-Irish | 99.6 /100 | #39 | Exceptional 4.8% |
| French | 99.6 /100 | #40 | Exceptional 4.8% |
| Tongans | 99.5 /100 | #41 | Exceptional 4.8% |
| Italians | 99.5 /100 | #42 | Exceptional 4.8% |
| Eastern Europeans | 99.4 /100 | #43 | Exceptional 4.9% |
| Greeks | 99.4 /100 | #44 | Exceptional 4.9% |
| Austrians | 99.3 /100 | #45 | Exceptional 4.9% |
| Immigrants | Bulgaria | 99.3 /100 | #46 | Exceptional 4.9% |
| Okinawans | 99.3 /100 | #47 | Exceptional 4.9% |
| Thais | 99.2 /100 | #48 | Exceptional 4.9% |
| Australians | 99.2 /100 | #49 | Exceptional 4.9% |
| Immigrants | Cuba | 99.1 /100 | #50 | Exceptional 4.9% |
| Cambodians | 99.1 /100 | #51 | Exceptional 4.9% |
| Slavs | 99.1 /100 | #52 | Exceptional 4.9% |
| Whites/Caucasians | 99.0 /100 | #53 | Exceptional 4.9% |