Cheyenne vs Yaqui Unemployment Among Women with Children Under 6 years
COMPARE
Cheyenne
Yaqui
Unemployment Among Women with Children Under 6 years
Unemployment Among Women with Children Under 6 years Comparison
Cheyenne
Yaqui
8.8%
UNEMPLOYMENT AMONG WOMEN WITH CHILDREN UNDER 6 YEARS
0.0/ 100
METRIC RATING
292nd/ 347
METRIC RANK
8.6%
UNEMPLOYMENT AMONG WOMEN WITH CHILDREN UNDER 6 YEARS
0.0/ 100
METRIC RATING
276th/ 347
METRIC RANK
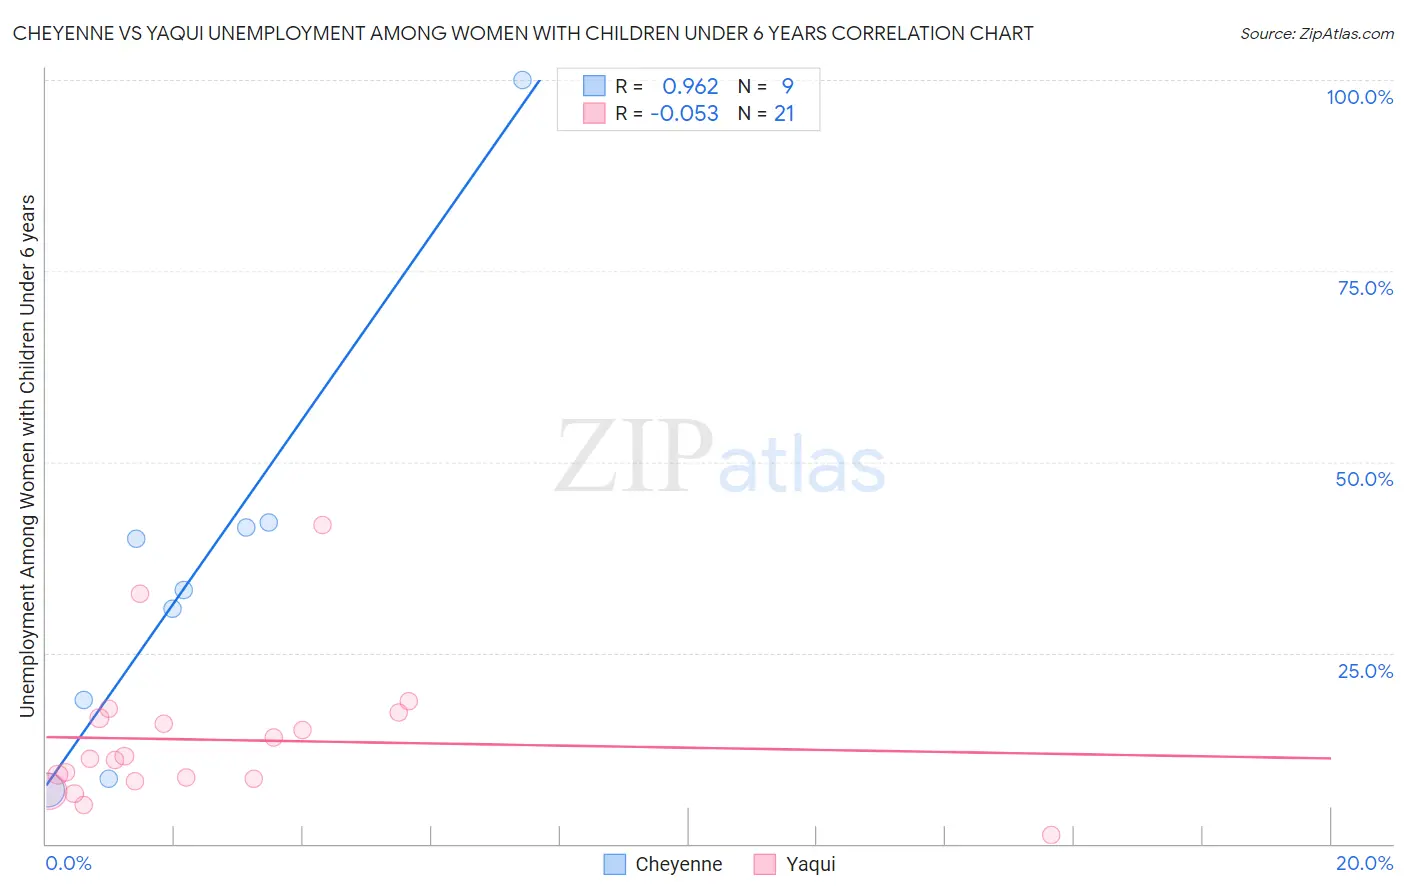
Cheyenne vs Yaqui Unemployment Among Women with Children Under 6 years Correlation Chart
The statistical analysis conducted on geographies consisting of 73,227,790 people shows a perfect positive correlation between the proportion of Cheyenne and unemployment rate among women with children under the age of 6 in the United States with a correlation coefficient (R) of 0.962 and weighted average of 8.8%. Similarly, the statistical analysis conducted on geographies consisting of 97,750,721 people shows a slight negative correlation between the proportion of Yaqui and unemployment rate among women with children under the age of 6 in the United States with a correlation coefficient (R) of -0.053 and weighted average of 8.6%, a difference of 2.4%.
Unemployment Among Women with Children Under 6 years Correlation Summary
| Measurement | Cheyenne | Yaqui |
| Minimum | 7.0% | 1.2% |
| Maximum | 100.0% | 41.7% |
| Range | 93.0% | 40.5% |
| Mean | 35.8% | 13.6% |
| Median | 33.3% | 11.2% |
| Interquartile 25% (IQ1) | 13.7% | 8.3% |
| Interquartile 75% (IQ3) | 41.7% | 16.8% |
| Interquartile Range (IQR) | 28.0% | 8.5% |
| Standard Deviation (Sample) | 27.6% | 9.2% |
| Standard Deviation (Population) | 26.0% | 9.0% |
Demographics Similar to Cheyenne and Yaqui by Unemployment Among Women with Children Under 6 years
In terms of unemployment among women with children under 6 years, the demographic groups most similar to Cheyenne are Immigrants from Bangladesh (8.8%, a difference of 0.23%), Jamaican (8.8%, a difference of 0.25%), Nonimmigrants (8.8%, a difference of 0.42%), Vietnamese (8.8%, a difference of 0.69%), and Iroquois (8.7%, a difference of 0.84%). Similarly, the demographic groups most similar to Yaqui are Haitian (8.6%, a difference of 0.10%), Immigrants from Latin America (8.6%, a difference of 0.34%), Immigrants from Dominica (8.6%, a difference of 0.38%), Immigrants from Guatemala (8.6%, a difference of 0.39%), and Immigrants from Cameroon (8.6%, a difference of 0.40%).
| Demographics | Rating | Rank | Unemployment Among Women with Children Under 6 years |
| Immigrants | Cameroon | 0.1 /100 | #274 | Tragic 8.6% |
| Immigrants | Latin America | 0.1 /100 | #275 | Tragic 8.6% |
| Yaqui | 0.0 /100 | #276 | Tragic 8.6% |
| Haitians | 0.0 /100 | #277 | Tragic 8.6% |
| Immigrants | Dominica | 0.0 /100 | #278 | Tragic 8.6% |
| Immigrants | Guatemala | 0.0 /100 | #279 | Tragic 8.6% |
| Immigrants | Belize | 0.0 /100 | #280 | Tragic 8.6% |
| Guatemalans | 0.0 /100 | #281 | Tragic 8.7% |
| Bermudans | 0.0 /100 | #282 | Tragic 8.7% |
| Spanish American Indians | 0.0 /100 | #283 | Tragic 8.7% |
| Blackfeet | 0.0 /100 | #284 | Tragic 8.7% |
| U.S. Virgin Islanders | 0.0 /100 | #285 | Tragic 8.7% |
| Seminole | 0.0 /100 | #286 | Tragic 8.7% |
| Menominee | 0.0 /100 | #287 | Tragic 8.7% |
| Bahamians | 0.0 /100 | #288 | Tragic 8.7% |
| Iroquois | 0.0 /100 | #289 | Tragic 8.7% |
| Vietnamese | 0.0 /100 | #290 | Tragic 8.8% |
| Jamaicans | 0.0 /100 | #291 | Tragic 8.8% |
| Cheyenne | 0.0 /100 | #292 | Tragic 8.8% |
| Immigrants | Bangladesh | 0.0 /100 | #293 | Tragic 8.8% |
| Immigrants | Nonimmigrants | 0.0 /100 | #294 | Tragic 8.8% |