Chippewa vs Japanese Male Unemployment
COMPARE
Chippewa
Japanese
Male Unemployment
Male Unemployment Comparison
Chippewa
Japanese
6.6%
MALE UNEMPLOYMENT
0.0/ 100
METRIC RATING
297th/ 347
METRIC RANK
5.8%
MALE UNEMPLOYMENT
0.2/ 100
METRIC RATING
254th/ 347
METRIC RANK
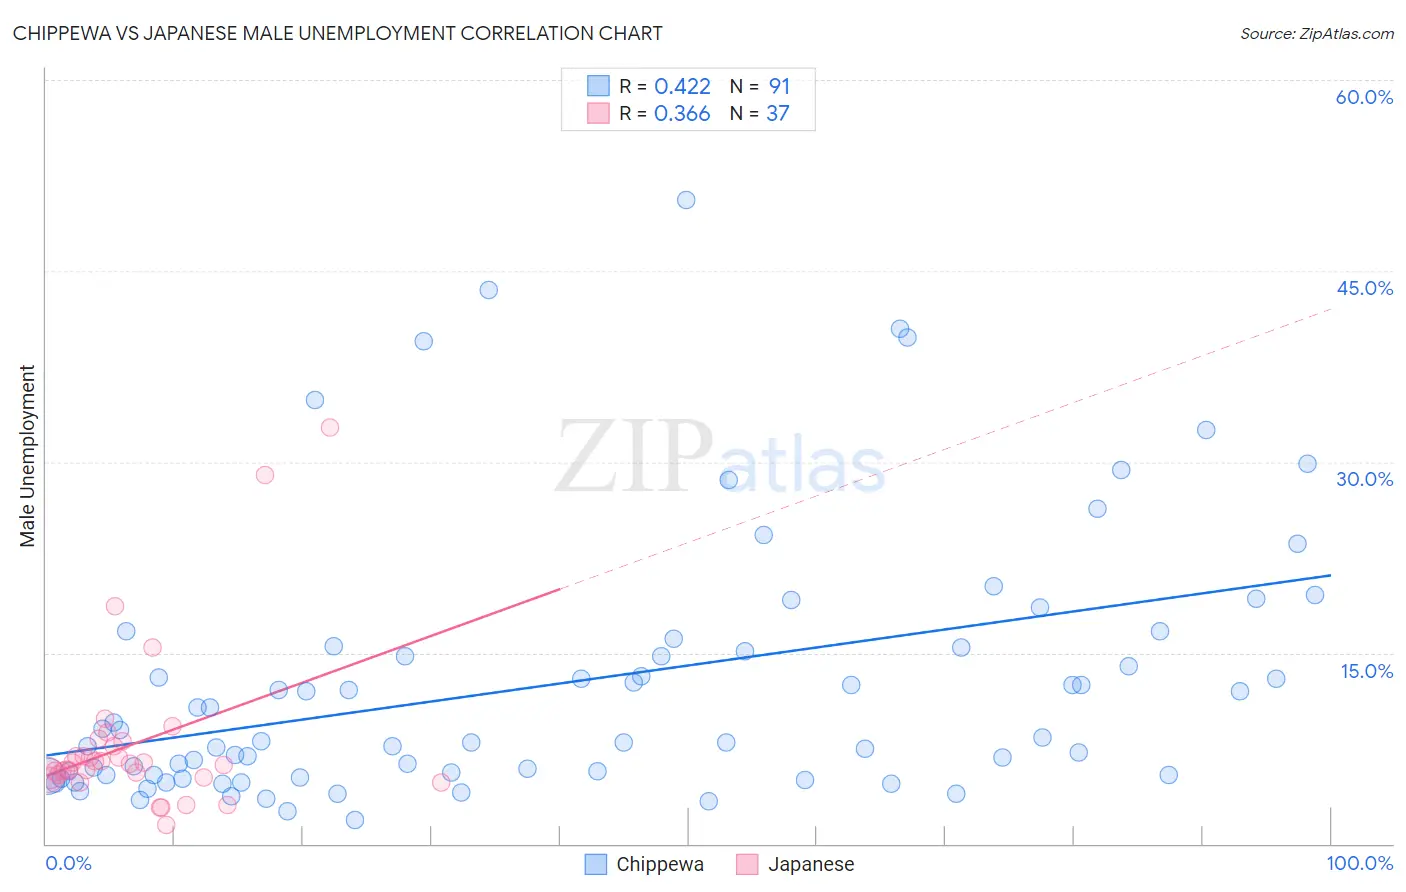
Chippewa vs Japanese Male Unemployment Correlation Chart
The statistical analysis conducted on geographies consisting of 214,243,166 people shows a moderate positive correlation between the proportion of Chippewa and unemployment rate among males in the United States with a correlation coefficient (R) of 0.422 and weighted average of 6.6%. Similarly, the statistical analysis conducted on geographies consisting of 248,784,678 people shows a mild positive correlation between the proportion of Japanese and unemployment rate among males in the United States with a correlation coefficient (R) of 0.366 and weighted average of 5.8%, a difference of 13.3%.
Male Unemployment Correlation Summary
| Measurement | Chippewa | Japanese |
| Minimum | 1.9% | 1.5% |
| Maximum | 50.6% | 32.7% |
| Range | 48.7% | 31.2% |
| Mean | 12.5% | 7.9% |
| Median | 8.0% | 6.3% |
| Interquartile 25% (IQ1) | 5.4% | 5.3% |
| Interquartile 75% (IQ3) | 15.4% | 7.9% |
| Interquartile Range (IQR) | 10.0% | 2.6% |
| Standard Deviation (Sample) | 10.3% | 6.4% |
| Standard Deviation (Population) | 10.3% | 6.3% |
Similar Demographics by Male Unemployment
Demographics Similar to Chippewa by Male Unemployment
In terms of male unemployment, the demographic groups most similar to Chippewa are Jamaican (6.6%, a difference of 0.080%), Immigrants from Bangladesh (6.6%, a difference of 0.21%), Immigrants from Haiti (6.5%, a difference of 0.32%), Vietnamese (6.6%, a difference of 0.48%), and Immigrants from Belize (6.6%, a difference of 0.58%).
| Demographics | Rating | Rank | Male Unemployment |
| U.S. Virgin Islanders | 0.0 /100 | #290 | Tragic 6.4% |
| Immigrants | Azores | 0.0 /100 | #291 | Tragic 6.4% |
| Nepalese | 0.0 /100 | #292 | Tragic 6.4% |
| Haitians | 0.0 /100 | #293 | Tragic 6.4% |
| Senegalese | 0.0 /100 | #294 | Tragic 6.4% |
| Belizeans | 0.0 /100 | #295 | Tragic 6.5% |
| Immigrants | Haiti | 0.0 /100 | #296 | Tragic 6.5% |
| Chippewa | 0.0 /100 | #297 | Tragic 6.6% |
| Jamaicans | 0.0 /100 | #298 | Tragic 6.6% |
| Immigrants | Bangladesh | 0.0 /100 | #299 | Tragic 6.6% |
| Vietnamese | 0.0 /100 | #300 | Tragic 6.6% |
| Immigrants | Belize | 0.0 /100 | #301 | Tragic 6.6% |
| Ute | 0.0 /100 | #302 | Tragic 6.6% |
| Immigrants | West Indies | 0.0 /100 | #303 | Tragic 6.7% |
| West Indians | 0.0 /100 | #304 | Tragic 6.7% |
Demographics Similar to Japanese by Male Unemployment
In terms of male unemployment, the demographic groups most similar to Japanese are Kiowa (5.8%, a difference of 0.10%), Mexican American Indian (5.8%, a difference of 0.17%), Comanche (5.8%, a difference of 0.18%), Mexican (5.8%, a difference of 0.30%), and Hispanic or Latino (5.8%, a difference of 0.35%).
| Demographics | Rating | Rank | Male Unemployment |
| Hawaiians | 0.6 /100 | #247 | Tragic 5.7% |
| Marshallese | 0.5 /100 | #248 | Tragic 5.7% |
| Cree | 0.4 /100 | #249 | Tragic 5.7% |
| Immigrants | Bahamas | 0.4 /100 | #250 | Tragic 5.7% |
| Spanish Americans | 0.3 /100 | #251 | Tragic 5.7% |
| Mexicans | 0.2 /100 | #252 | Tragic 5.8% |
| Mexican American Indians | 0.2 /100 | #253 | Tragic 5.8% |
| Japanese | 0.2 /100 | #254 | Tragic 5.8% |
| Kiowa | 0.2 /100 | #255 | Tragic 5.8% |
| Comanche | 0.2 /100 | #256 | Tragic 5.8% |
| Hispanics or Latinos | 0.1 /100 | #257 | Tragic 5.8% |
| Dutch West Indians | 0.1 /100 | #258 | Tragic 5.8% |
| Cajuns | 0.1 /100 | #259 | Tragic 5.8% |
| Immigrants | Central America | 0.1 /100 | #260 | Tragic 5.8% |
| Liberians | 0.1 /100 | #261 | Tragic 5.8% |