Chippewa vs Spanish American Indian Unemployment Among Ages 30 to 34 years
COMPARE
Chippewa
Spanish American Indian
Unemployment Among Ages 30 to 34 years
Unemployment Among Ages 30 to 34 years Comparison
Chippewa
Spanish American Indians
7.8%
UNEMPLOYMENT AMONG AGES 30 TO 34 YEARS
0.0/ 100
METRIC RATING
328th/ 347
METRIC RANK
5.7%
UNEMPLOYMENT AMONG AGES 30 TO 34 YEARS
8.7/ 100
METRIC RATING
211th/ 347
METRIC RANK
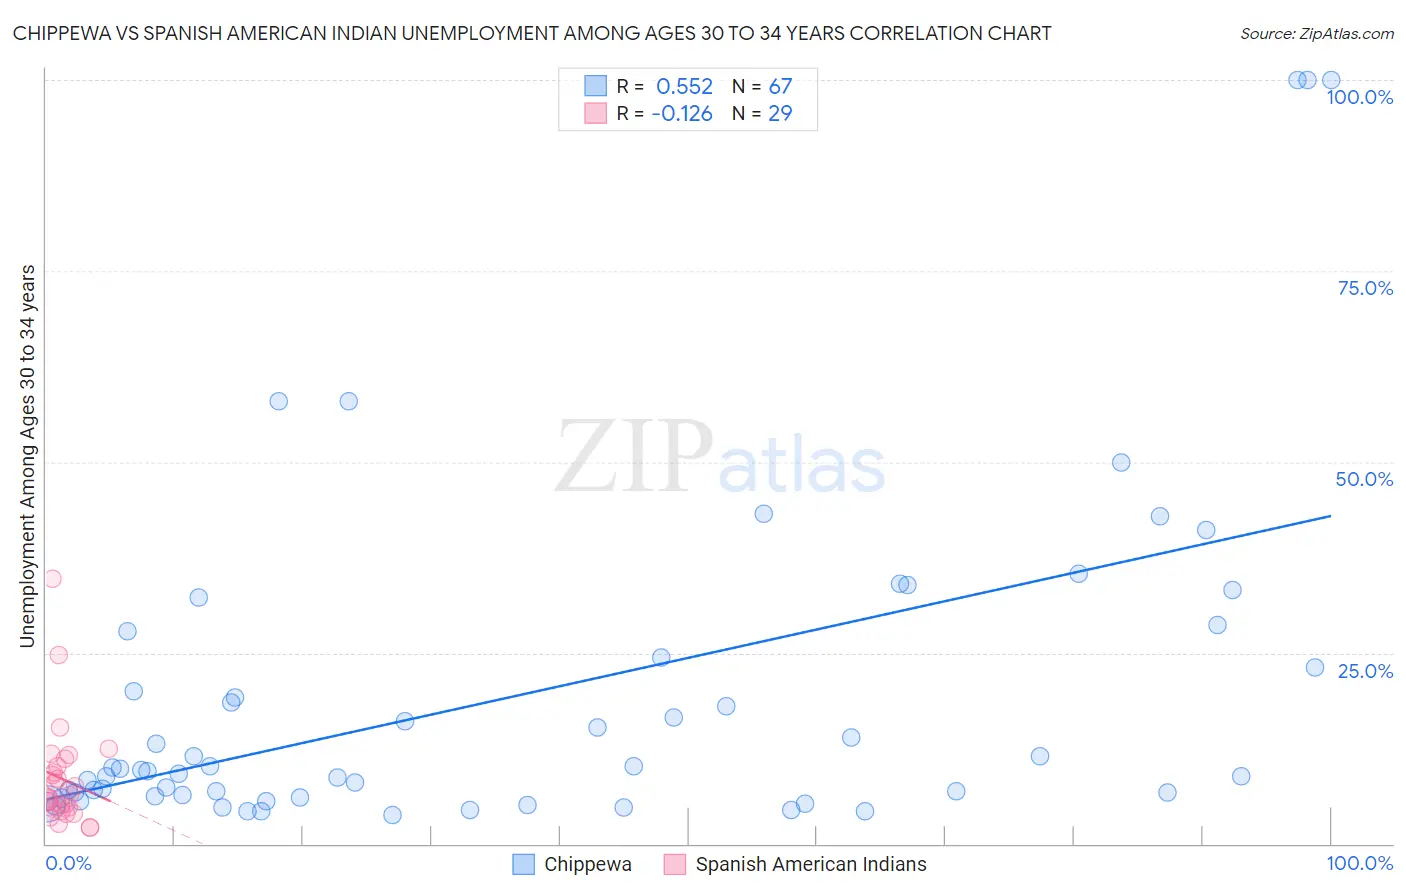
Chippewa vs Spanish American Indian Unemployment Among Ages 30 to 34 years Correlation Chart
The statistical analysis conducted on geographies consisting of 205,184,240 people shows a substantial positive correlation between the proportion of Chippewa and unemployment rate among population between the ages 30 and 34 in the United States with a correlation coefficient (R) of 0.552 and weighted average of 7.8%. Similarly, the statistical analysis conducted on geographies consisting of 72,390,675 people shows a poor negative correlation between the proportion of Spanish American Indians and unemployment rate among population between the ages 30 and 34 in the United States with a correlation coefficient (R) of -0.126 and weighted average of 5.7%, a difference of 36.5%.
Unemployment Among Ages 30 to 34 years Correlation Summary
| Measurement | Chippewa | Spanish American Indian |
| Minimum | 3.8% | 2.1% |
| Maximum | 100.0% | 34.6% |
| Range | 96.2% | 32.5% |
| Mean | 19.4% | 8.5% |
| Median | 9.7% | 5.9% |
| Interquartile 25% (IQ1) | 6.2% | 4.5% |
| Interquartile 75% (IQ3) | 24.4% | 10.6% |
| Interquartile Range (IQR) | 18.3% | 6.1% |
| Standard Deviation (Sample) | 22.2% | 6.9% |
| Standard Deviation (Population) | 22.1% | 6.8% |
Similar Demographics by Unemployment Among Ages 30 to 34 years
Demographics Similar to Chippewa by Unemployment Among Ages 30 to 34 years
In terms of unemployment among ages 30 to 34 years, the demographic groups most similar to Chippewa are Immigrants from Dominican Republic (7.7%, a difference of 0.27%), Dominican (7.7%, a difference of 0.99%), Cheyenne (7.8%, a difference of 1.1%), Shoshone (7.9%, a difference of 2.0%), and Sioux (8.0%, a difference of 3.4%).
| Demographics | Rating | Rank | Unemployment Among Ages 30 to 34 years |
| Immigrants | Guyana | 0.0 /100 | #321 | Tragic 7.2% |
| Marshallese | 0.0 /100 | #322 | Tragic 7.2% |
| Immigrants | Yemen | 0.0 /100 | #323 | Tragic 7.3% |
| Immigrants | Dominica | 0.0 /100 | #324 | Tragic 7.3% |
| Apache | 0.0 /100 | #325 | Tragic 7.3% |
| Dominicans | 0.0 /100 | #326 | Tragic 7.7% |
| Immigrants | Dominican Republic | 0.0 /100 | #327 | Tragic 7.7% |
| Chippewa | 0.0 /100 | #328 | Tragic 7.8% |
| Cheyenne | 0.0 /100 | #329 | Tragic 7.8% |
| Shoshone | 0.0 /100 | #330 | Tragic 7.9% |
| Sioux | 0.0 /100 | #331 | Tragic 8.0% |
| Natives/Alaskans | 0.0 /100 | #332 | Tragic 8.2% |
| Pueblo | 0.0 /100 | #333 | Tragic 8.3% |
| Alaska Natives | 0.0 /100 | #334 | Tragic 8.5% |
| Puerto Ricans | 0.0 /100 | #335 | Tragic 8.9% |
Demographics Similar to Spanish American Indians by Unemployment Among Ages 30 to 34 years
In terms of unemployment among ages 30 to 34 years, the demographic groups most similar to Spanish American Indians are Scotch-Irish (5.7%, a difference of 0.010%), White/Caucasian (5.7%, a difference of 0.10%), Immigrants (5.7%, a difference of 0.37%), French (5.7%, a difference of 0.41%), and Immigrants from Philippines (5.7%, a difference of 0.53%).
| Demographics | Rating | Rank | Unemployment Among Ages 30 to 34 years |
| Immigrants | Cameroon | 18.4 /100 | #204 | Poor 5.6% |
| Immigrants | Costa Rica | 14.4 /100 | #205 | Poor 5.6% |
| Alsatians | 14.3 /100 | #206 | Poor 5.6% |
| Israelis | 12.8 /100 | #207 | Poor 5.6% |
| Immigrants | Philippines | 11.5 /100 | #208 | Poor 5.7% |
| French | 10.8 /100 | #209 | Poor 5.7% |
| Whites/Caucasians | 9.2 /100 | #210 | Tragic 5.7% |
| Spanish American Indians | 8.7 /100 | #211 | Tragic 5.7% |
| Scotch-Irish | 8.6 /100 | #212 | Tragic 5.7% |
| Immigrants | Immigrants | 7.1 /100 | #213 | Tragic 5.7% |
| Immigrants | Panama | 5.9 /100 | #214 | Tragic 5.7% |
| Immigrants | Cambodia | 5.8 /100 | #215 | Tragic 5.7% |
| Immigrants | Syria | 5.5 /100 | #216 | Tragic 5.7% |
| Immigrants | Fiji | 5.1 /100 | #217 | Tragic 5.7% |
| Panamanians | 4.5 /100 | #218 | Tragic 5.8% |