Cree vs Immigrants from Central America Unemployment Among Women with Children Under 18 years
COMPARE
Cree
Immigrants from Central America
Unemployment Among Women with Children Under 18 years
Unemployment Among Women with Children Under 18 years Comparison
Cree
Immigrants from Central America
6.3%
UNEMPLOYMENT AMONG WOMEN WITH CHILDREN UNDER 18 YEARS
0.0/ 100
METRIC RATING
288th/ 347
METRIC RANK
6.5%
UNEMPLOYMENT AMONG WOMEN WITH CHILDREN UNDER 18 YEARS
0.0/ 100
METRIC RATING
305th/ 347
METRIC RANK
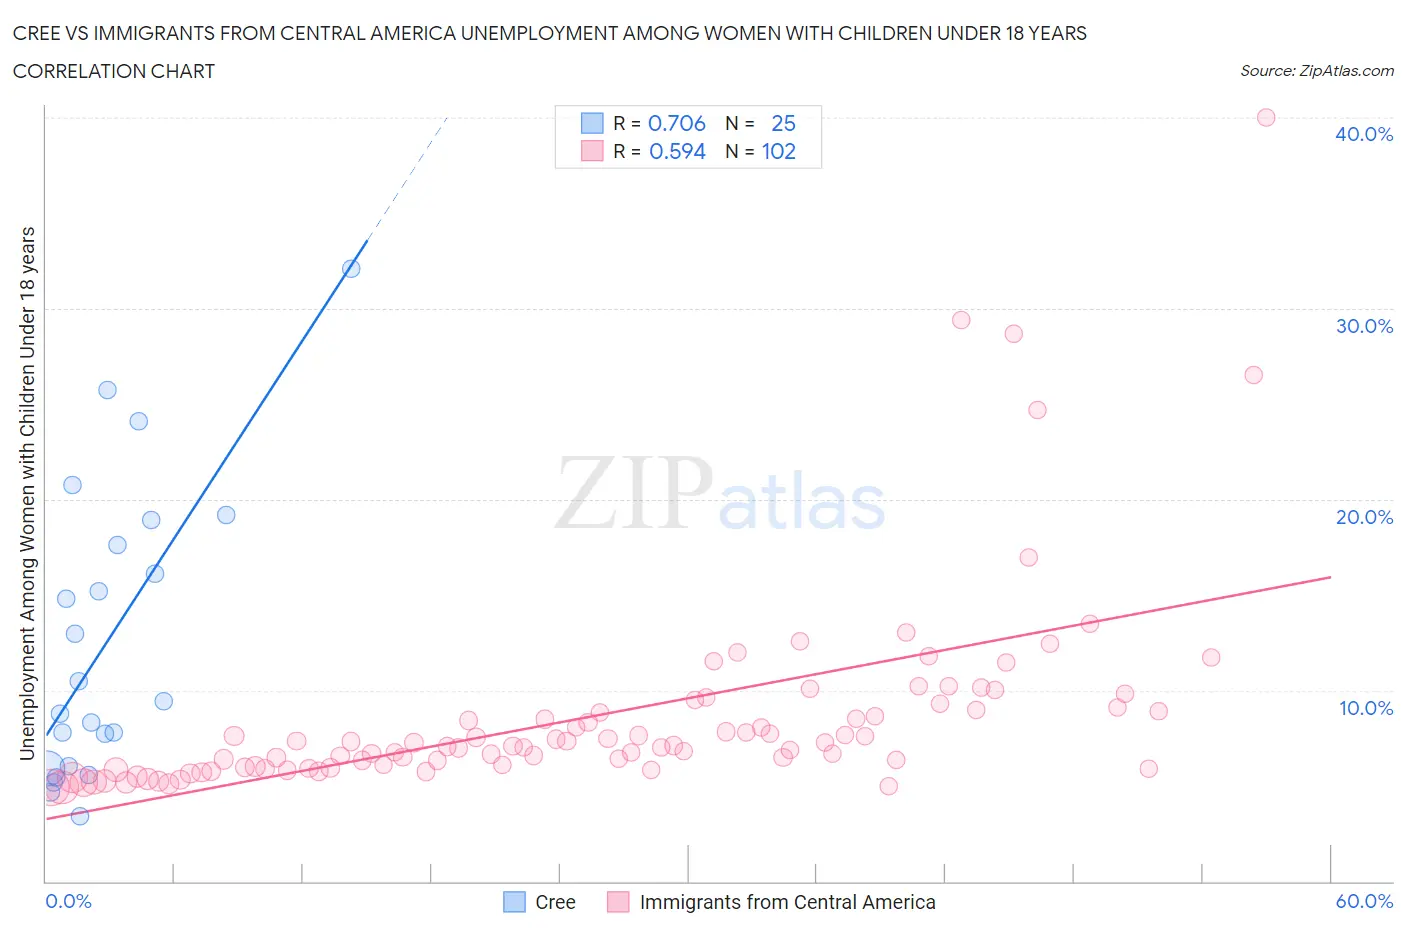
Cree vs Immigrants from Central America Unemployment Among Women with Children Under 18 years Correlation Chart
The statistical analysis conducted on geographies consisting of 75,145,455 people shows a strong positive correlation between the proportion of Cree and unemployment rate among women with children under the age of 18 in the United States with a correlation coefficient (R) of 0.706 and weighted average of 6.3%. Similarly, the statistical analysis conducted on geographies consisting of 496,300,462 people shows a substantial positive correlation between the proportion of Immigrants from Central America and unemployment rate among women with children under the age of 18 in the United States with a correlation coefficient (R) of 0.594 and weighted average of 6.5%, a difference of 2.8%.
Unemployment Among Women with Children Under 18 years Correlation Summary
| Measurement | Cree | Immigrants from Central America |
| Minimum | 3.4% | 4.9% |
| Maximum | 32.1% | 40.0% |
| Range | 28.7% | 35.1% |
| Mean | 12.6% | 8.7% |
| Median | 9.4% | 7.1% |
| Interquartile 25% (IQ1) | 5.9% | 5.9% |
| Interquartile 75% (IQ3) | 18.2% | 9.0% |
| Interquartile Range (IQR) | 12.3% | 3.0% |
| Standard Deviation (Sample) | 7.6% | 5.4% |
| Standard Deviation (Population) | 7.5% | 5.4% |
Demographics Similar to Cree and Immigrants from Central America by Unemployment Among Women with Children Under 18 years
In terms of unemployment among women with children under 18 years, the demographic groups most similar to Cree are Kiowa (6.3%, a difference of 0.12%), Alaskan Athabascan (6.3%, a difference of 0.13%), Immigrants from Caribbean (6.4%, a difference of 0.36%), Blackfeet (6.4%, a difference of 0.40%), and Immigrants from Guatemala (6.4%, a difference of 0.53%). Similarly, the demographic groups most similar to Immigrants from Central America are Immigrants from Guyana (6.5%, a difference of 0.050%), Immigrants from Honduras (6.5%, a difference of 0.71%), Vietnamese (6.5%, a difference of 0.71%), Immigrants from Armenia (6.5%, a difference of 0.95%), and Immigrants from Haiti (6.4%, a difference of 1.2%).
| Demographics | Rating | Rank | Unemployment Among Women with Children Under 18 years |
| Alaskan Athabascans | 0.0 /100 | #286 | Tragic 6.3% |
| Kiowa | 0.0 /100 | #287 | Tragic 6.3% |
| Cree | 0.0 /100 | #288 | Tragic 6.3% |
| Immigrants | Caribbean | 0.0 /100 | #289 | Tragic 6.4% |
| Blackfeet | 0.0 /100 | #290 | Tragic 6.4% |
| Immigrants | Guatemala | 0.0 /100 | #291 | Tragic 6.4% |
| Mexicans | 0.0 /100 | #292 | Tragic 6.4% |
| Immigrants | Bangladesh | 0.0 /100 | #293 | Tragic 6.4% |
| Hondurans | 0.0 /100 | #294 | Tragic 6.4% |
| Barbadians | 0.0 /100 | #295 | Tragic 6.4% |
| Haitians | 0.0 /100 | #296 | Tragic 6.4% |
| Immigrants | Senegal | 0.0 /100 | #297 | Tragic 6.4% |
| Immigrants | Latin America | 0.0 /100 | #298 | Tragic 6.4% |
| Jamaicans | 0.0 /100 | #299 | Tragic 6.4% |
| Immigrants | Jamaica | 0.0 /100 | #300 | Tragic 6.4% |
| Immigrants | Haiti | 0.0 /100 | #301 | Tragic 6.4% |
| Immigrants | Armenia | 0.0 /100 | #302 | Tragic 6.5% |
| Immigrants | Honduras | 0.0 /100 | #303 | Tragic 6.5% |
| Vietnamese | 0.0 /100 | #304 | Tragic 6.5% |
| Immigrants | Central America | 0.0 /100 | #305 | Tragic 6.5% |
| Immigrants | Guyana | 0.0 /100 | #306 | Tragic 6.5% |