Czechoslovakian vs Immigrants from Guyana Male Unemployment
COMPARE
Czechoslovakian
Immigrants from Guyana
Male Unemployment
Male Unemployment Comparison
Czechoslovakians
Immigrants from Guyana
5.0%
MALE UNEMPLOYMENT
98.7/ 100
METRIC RATING
55th/ 347
METRIC RANK
7.1%
MALE UNEMPLOYMENT
0.0/ 100
METRIC RATING
316th/ 347
METRIC RANK
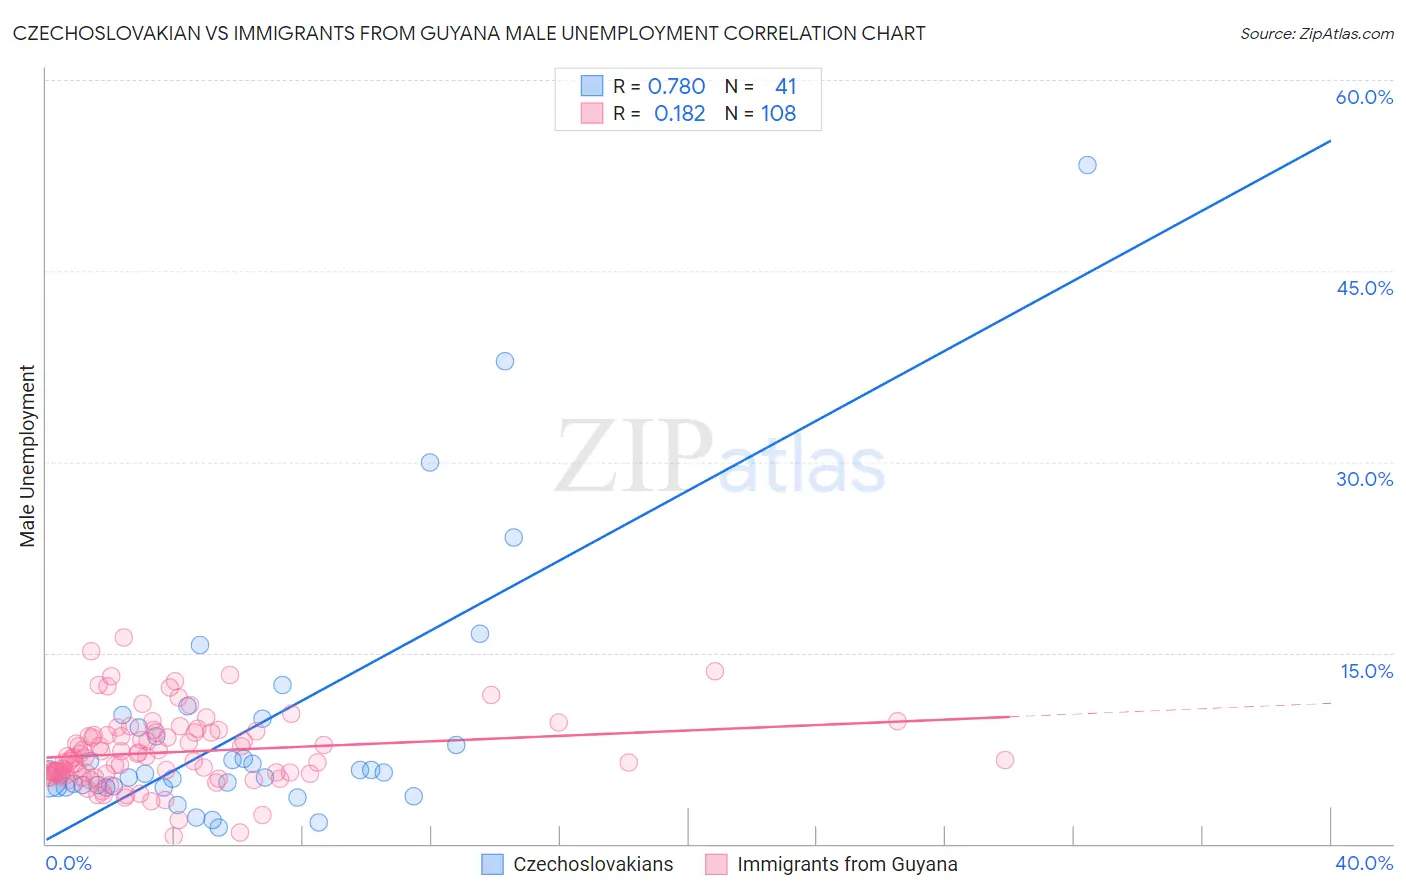
Czechoslovakian vs Immigrants from Guyana Male Unemployment Correlation Chart
The statistical analysis conducted on geographies consisting of 366,692,431 people shows a strong positive correlation between the proportion of Czechoslovakians and unemployment rate among males in the United States with a correlation coefficient (R) of 0.780 and weighted average of 5.0%. Similarly, the statistical analysis conducted on geographies consisting of 183,427,886 people shows a poor positive correlation between the proportion of Immigrants from Guyana and unemployment rate among males in the United States with a correlation coefficient (R) of 0.182 and weighted average of 7.1%, a difference of 43.4%.
Male Unemployment Correlation Summary
| Measurement | Czechoslovakian | Immigrants from Guyana |
| Minimum | 1.3% | 0.60% |
| Maximum | 53.3% | 16.2% |
| Range | 52.0% | 15.6% |
| Mean | 9.1% | 7.2% |
| Median | 5.5% | 6.7% |
| Interquartile 25% (IQ1) | 4.5% | 5.4% |
| Interquartile 75% (IQ3) | 9.5% | 8.7% |
| Interquartile Range (IQR) | 5.1% | 3.3% |
| Standard Deviation (Sample) | 10.2% | 2.8% |
| Standard Deviation (Population) | 10.1% | 2.8% |
Similar Demographics by Male Unemployment
Demographics Similar to Czechoslovakians by Male Unemployment
In terms of male unemployment, the demographic groups most similar to Czechoslovakians are Yugoslavian (5.0%, a difference of 0.0%), Immigrants from Bulgaria (5.0%, a difference of 0.0%), Jordanian (5.0%, a difference of 0.11%), Irish (5.0%, a difference of 0.17%), and Slovene (5.0%, a difference of 0.19%).
| Demographics | Rating | Rank | Male Unemployment |
| Immigrants | Scotland | 98.9 /100 | #48 | Exceptional 4.9% |
| Poles | 98.9 /100 | #49 | Exceptional 4.9% |
| Croatians | 98.9 /100 | #50 | Exceptional 4.9% |
| Slovenes | 98.8 /100 | #51 | Exceptional 5.0% |
| Irish | 98.8 /100 | #52 | Exceptional 5.0% |
| Jordanians | 98.8 /100 | #53 | Exceptional 5.0% |
| Yugoslavians | 98.7 /100 | #54 | Exceptional 5.0% |
| Czechoslovakians | 98.7 /100 | #55 | Exceptional 5.0% |
| Immigrants | Bulgaria | 98.7 /100 | #56 | Exceptional 5.0% |
| Turks | 98.5 /100 | #57 | Exceptional 5.0% |
| Lithuanians | 98.5 /100 | #58 | Exceptional 5.0% |
| Immigrants | Netherlands | 98.3 /100 | #59 | Exceptional 5.0% |
| Immigrants | Argentina | 98.1 /100 | #60 | Exceptional 5.0% |
| Cambodians | 98.1 /100 | #61 | Exceptional 5.0% |
| Basques | 97.9 /100 | #62 | Exceptional 5.0% |
Demographics Similar to Immigrants from Guyana by Male Unemployment
In terms of male unemployment, the demographic groups most similar to Immigrants from Guyana are Houma (7.1%, a difference of 0.030%), Guyanese (7.1%, a difference of 0.060%), Cape Verdean (7.1%, a difference of 0.12%), Immigrants from Barbados (7.1%, a difference of 0.24%), and Immigrants from Dominica (7.0%, a difference of 1.5%).
| Demographics | Rating | Rank | Male Unemployment |
| Barbadians | 0.0 /100 | #309 | Tragic 6.9% |
| Blacks/African Americans | 0.0 /100 | #310 | Tragic 6.9% |
| Immigrants | Armenia | 0.0 /100 | #311 | Tragic 6.9% |
| Lumbee | 0.0 /100 | #312 | Tragic 6.9% |
| Immigrants | Dominica | 0.0 /100 | #313 | Tragic 7.0% |
| Immigrants | Barbados | 0.0 /100 | #314 | Tragic 7.1% |
| Houma | 0.0 /100 | #315 | Tragic 7.1% |
| Immigrants | Guyana | 0.0 /100 | #316 | Tragic 7.1% |
| Guyanese | 0.0 /100 | #317 | Tragic 7.1% |
| Cape Verdeans | 0.0 /100 | #318 | Tragic 7.1% |
| British West Indians | 0.0 /100 | #319 | Tragic 7.3% |
| Colville | 0.0 /100 | #320 | Tragic 7.4% |
| Immigrants | St. Vincent and the Grenadines | 0.0 /100 | #321 | Tragic 7.5% |
| Immigrants | Cabo Verde | 0.0 /100 | #322 | Tragic 7.5% |
| Immigrants | Grenada | 0.0 /100 | #323 | Tragic 7.6% |