Guamanian/Chamorro vs Immigrants from Thailand Female Unemployment
COMPARE
Guamanian/Chamorro
Immigrants from Thailand
Female Unemployment
Female Unemployment Comparison
Guamanians/Chamorros
Immigrants from Thailand
5.6%
FEMALE UNEMPLOYMENT
1.4/ 100
METRIC RATING
245th/ 347
METRIC RANK
5.2%
FEMALE UNEMPLOYMENT
62.1/ 100
METRIC RATING
167th/ 347
METRIC RANK
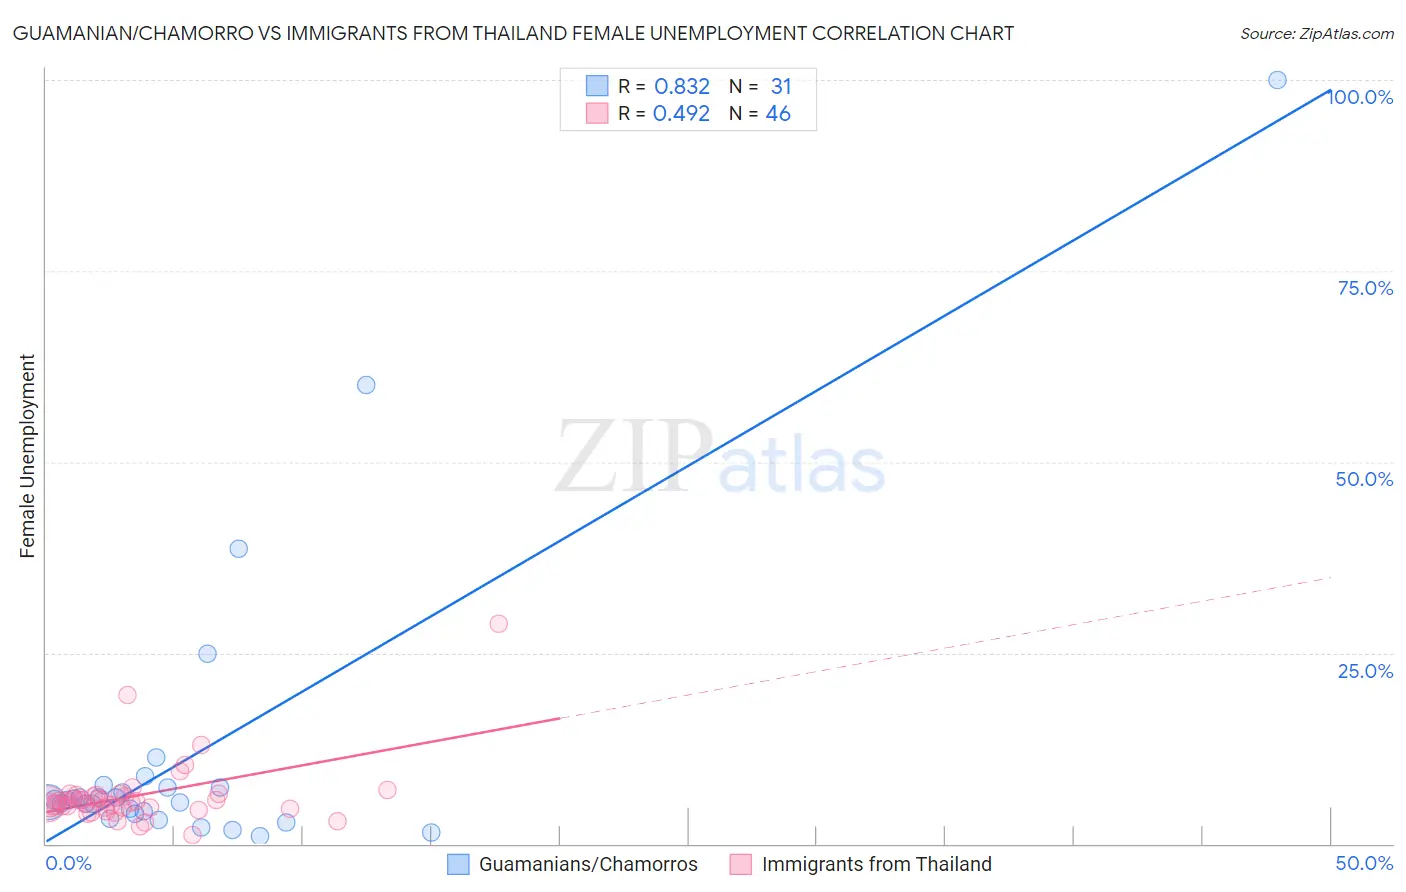
Guamanian/Chamorro vs Immigrants from Thailand Female Unemployment Correlation Chart
The statistical analysis conducted on geographies consisting of 221,394,828 people shows a very strong positive correlation between the proportion of Guamanians/Chamorros and unemploymnet rate among females in the United States with a correlation coefficient (R) of 0.832 and weighted average of 5.6%. Similarly, the statistical analysis conducted on geographies consisting of 316,285,605 people shows a moderate positive correlation between the proportion of Immigrants from Thailand and unemploymnet rate among females in the United States with a correlation coefficient (R) of 0.492 and weighted average of 5.2%, a difference of 7.2%.
Female Unemployment Correlation Summary
| Measurement | Guamanian/Chamorro | Immigrants from Thailand |
| Minimum | 1.0% | 1.2% |
| Maximum | 100.0% | 28.8% |
| Range | 99.0% | 27.6% |
| Mean | 11.7% | 6.3% |
| Median | 5.7% | 5.5% |
| Interquartile 25% (IQ1) | 3.9% | 4.8% |
| Interquartile 75% (IQ3) | 7.4% | 6.4% |
| Interquartile Range (IQR) | 3.5% | 1.7% |
| Standard Deviation (Sample) | 20.3% | 4.4% |
| Standard Deviation (Population) | 19.9% | 4.4% |
Similar Demographics by Female Unemployment
Demographics Similar to Guamanians/Chamorros by Female Unemployment
In terms of female unemployment, the demographic groups most similar to Guamanians/Chamorros are Immigrants from Liberia (5.6%, a difference of 0.14%), Japanese (5.6%, a difference of 0.23%), Immigrants from Western Asia (5.6%, a difference of 0.31%), Cree (5.6%, a difference of 0.47%), and Immigrants from Uzbekistan (5.6%, a difference of 0.51%).
| Demographics | Rating | Rank | Female Unemployment |
| Sierra Leoneans | 3.2 /100 | #238 | Tragic 5.5% |
| Aleuts | 3.0 /100 | #239 | Tragic 5.5% |
| Immigrants | South America | 2.9 /100 | #240 | Tragic 5.5% |
| South American Indians | 2.8 /100 | #241 | Tragic 5.5% |
| Marshallese | 2.3 /100 | #242 | Tragic 5.6% |
| Spanish Americans | 2.2 /100 | #243 | Tragic 5.6% |
| Immigrants | Liberia | 1.5 /100 | #244 | Tragic 5.6% |
| Guamanians/Chamorros | 1.4 /100 | #245 | Tragic 5.6% |
| Japanese | 1.2 /100 | #246 | Tragic 5.6% |
| Immigrants | Western Asia | 1.1 /100 | #247 | Tragic 5.6% |
| Cree | 1.0 /100 | #248 | Tragic 5.6% |
| Immigrants | Uzbekistan | 1.0 /100 | #249 | Tragic 5.6% |
| Immigrants | Syria | 0.8 /100 | #250 | Tragic 5.6% |
| Assyrians/Chaldeans/Syriacs | 0.8 /100 | #251 | Tragic 5.6% |
| Cajuns | 0.7 /100 | #252 | Tragic 5.7% |
Demographics Similar to Immigrants from Thailand by Female Unemployment
In terms of female unemployment, the demographic groups most similar to Immigrants from Thailand are Syrian (5.2%, a difference of 0.040%), Native Hawaiian (5.2%, a difference of 0.040%), Immigrants from Asia (5.2%, a difference of 0.14%), Bangladeshi (5.2%, a difference of 0.14%), and Sri Lankan (5.2%, a difference of 0.17%).
| Demographics | Rating | Rank | Female Unemployment |
| Immigrants | Spain | 66.8 /100 | #160 | Good 5.2% |
| Immigrants | Pakistan | 66.7 /100 | #161 | Good 5.2% |
| Potawatomi | 65.9 /100 | #162 | Good 5.2% |
| Immigrants | Asia | 64.3 /100 | #163 | Good 5.2% |
| Bangladeshis | 64.3 /100 | #164 | Good 5.2% |
| Syrians | 62.8 /100 | #165 | Good 5.2% |
| Native Hawaiians | 62.7 /100 | #166 | Good 5.2% |
| Immigrants | Thailand | 62.1 /100 | #167 | Good 5.2% |
| Sri Lankans | 59.4 /100 | #168 | Average 5.2% |
| Immigrants | Chile | 59.0 /100 | #169 | Average 5.2% |
| Spanish | 55.9 /100 | #170 | Average 5.2% |
| Immigrants | Denmark | 55.0 /100 | #171 | Average 5.2% |
| Immigrants | Uganda | 50.7 /100 | #172 | Average 5.3% |
| Iranians | 50.4 /100 | #173 | Average 5.3% |
| Immigrants | Poland | 50.0 /100 | #174 | Average 5.3% |