Guyanese vs Immigrants from Lebanon Male Unemployment
COMPARE
Guyanese
Immigrants from Lebanon
Male Unemployment
Male Unemployment Comparison
Guyanese
Immigrants from Lebanon
7.1%
MALE UNEMPLOYMENT
0.0/ 100
METRIC RATING
317th/ 347
METRIC RANK
5.5%
MALE UNEMPLOYMENT
8.6/ 100
METRIC RATING
208th/ 347
METRIC RANK
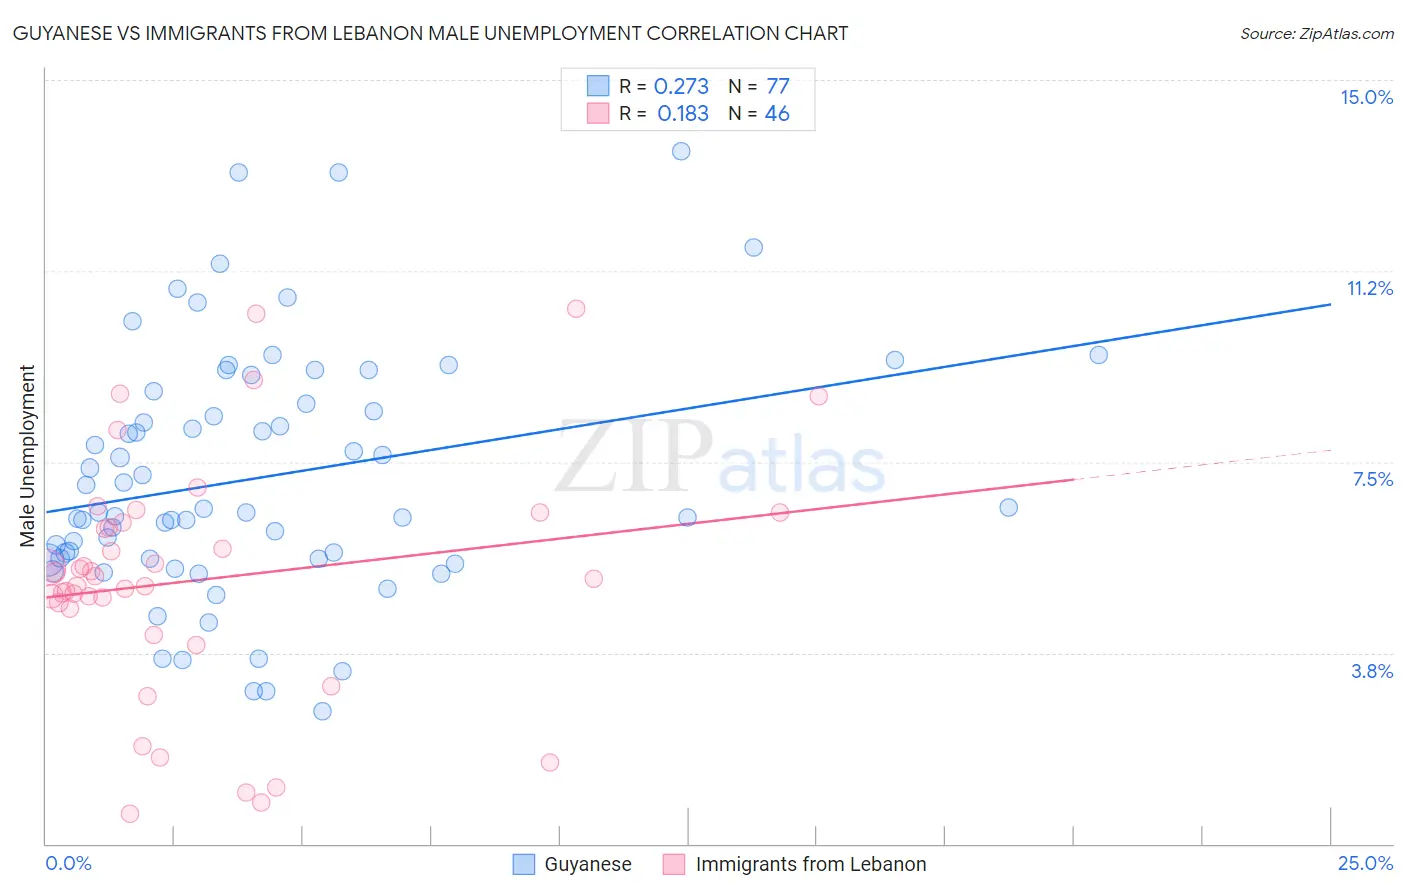
Guyanese vs Immigrants from Lebanon Male Unemployment Correlation Chart
The statistical analysis conducted on geographies consisting of 176,637,764 people shows a weak positive correlation between the proportion of Guyanese and unemployment rate among males in the United States with a correlation coefficient (R) of 0.273 and weighted average of 7.1%. Similarly, the statistical analysis conducted on geographies consisting of 216,995,040 people shows a poor positive correlation between the proportion of Immigrants from Lebanon and unemployment rate among males in the United States with a correlation coefficient (R) of 0.183 and weighted average of 5.5%, a difference of 29.9%.
Male Unemployment Correlation Summary
| Measurement | Guyanese | Immigrants from Lebanon |
| Minimum | 2.6% | 0.59% |
| Maximum | 13.6% | 10.5% |
| Range | 11.0% | 9.9% |
| Mean | 7.2% | 5.2% |
| Median | 6.5% | 5.2% |
| Interquartile 25% (IQ1) | 5.6% | 4.6% |
| Interquartile 75% (IQ3) | 8.8% | 6.3% |
| Interquartile Range (IQR) | 3.2% | 1.7% |
| Standard Deviation (Sample) | 2.4% | 2.3% |
| Standard Deviation (Population) | 2.4% | 2.3% |
Similar Demographics by Male Unemployment
Demographics Similar to Guyanese by Male Unemployment
In terms of male unemployment, the demographic groups most similar to Guyanese are Immigrants from Guyana (7.1%, a difference of 0.060%), Cape Verdean (7.1%, a difference of 0.070%), Houma (7.1%, a difference of 0.080%), Immigrants from Barbados (7.1%, a difference of 0.30%), and Immigrants from Dominica (7.0%, a difference of 1.6%).
| Demographics | Rating | Rank | Male Unemployment |
| Blacks/African Americans | 0.0 /100 | #310 | Tragic 6.9% |
| Immigrants | Armenia | 0.0 /100 | #311 | Tragic 6.9% |
| Lumbee | 0.0 /100 | #312 | Tragic 6.9% |
| Immigrants | Dominica | 0.0 /100 | #313 | Tragic 7.0% |
| Immigrants | Barbados | 0.0 /100 | #314 | Tragic 7.1% |
| Houma | 0.0 /100 | #315 | Tragic 7.1% |
| Immigrants | Guyana | 0.0 /100 | #316 | Tragic 7.1% |
| Guyanese | 0.0 /100 | #317 | Tragic 7.1% |
| Cape Verdeans | 0.0 /100 | #318 | Tragic 7.1% |
| British West Indians | 0.0 /100 | #319 | Tragic 7.3% |
| Colville | 0.0 /100 | #320 | Tragic 7.4% |
| Immigrants | St. Vincent and the Grenadines | 0.0 /100 | #321 | Tragic 7.5% |
| Immigrants | Cabo Verde | 0.0 /100 | #322 | Tragic 7.5% |
| Immigrants | Grenada | 0.0 /100 | #323 | Tragic 7.6% |
| Dominicans | 0.0 /100 | #324 | Tragic 7.6% |
Demographics Similar to Immigrants from Lebanon by Male Unemployment
In terms of male unemployment, the demographic groups most similar to Immigrants from Lebanon are Immigrants from Middle Africa (5.5%, a difference of 0.050%), Immigrants from Syria (5.5%, a difference of 0.13%), South American Indian (5.5%, a difference of 0.18%), Israeli (5.5%, a difference of 0.22%), and Immigrants from Ukraine (5.5%, a difference of 0.23%).
| Demographics | Rating | Rank | Male Unemployment |
| Immigrants | Philippines | 13.5 /100 | #201 | Poor 5.4% |
| Immigrants | Nonimmigrants | 13.1 /100 | #202 | Poor 5.4% |
| Immigrants | Laos | 13.0 /100 | #203 | Poor 5.4% |
| Guamanians/Chamorros | 12.3 /100 | #204 | Poor 5.4% |
| Immigrants | Costa Rica | 11.4 /100 | #205 | Poor 5.5% |
| Immigrants | Ukraine | 9.9 /100 | #206 | Tragic 5.5% |
| Immigrants | Syria | 9.3 /100 | #207 | Tragic 5.5% |
| Immigrants | Lebanon | 8.6 /100 | #208 | Tragic 5.5% |
| Immigrants | Middle Africa | 8.3 /100 | #209 | Tragic 5.5% |
| South American Indians | 7.6 /100 | #210 | Tragic 5.5% |
| Israelis | 7.4 /100 | #211 | Tragic 5.5% |
| Hmong | 7.0 /100 | #212 | Tragic 5.5% |
| Ugandans | 6.3 /100 | #213 | Tragic 5.5% |
| Puget Sound Salish | 5.6 /100 | #214 | Tragic 5.5% |
| Samoans | 4.9 /100 | #215 | Tragic 5.5% |