Hmong vs Lebanese Unemployment Among Ages 45 to 54 years
COMPARE
Hmong
Lebanese
Unemployment Among Ages 45 to 54 years
Unemployment Among Ages 45 to 54 years Comparison
Hmong
Lebanese
3.7%
UNEMPLOYMENT AMONG AGES 45 TO 54 YEARS
100.0/ 100
METRIC RATING
1st/ 347
METRIC RANK
4.4%
UNEMPLOYMENT AMONG AGES 45 TO 54 YEARS
81.9/ 100
METRIC RATING
137th/ 347
METRIC RANK
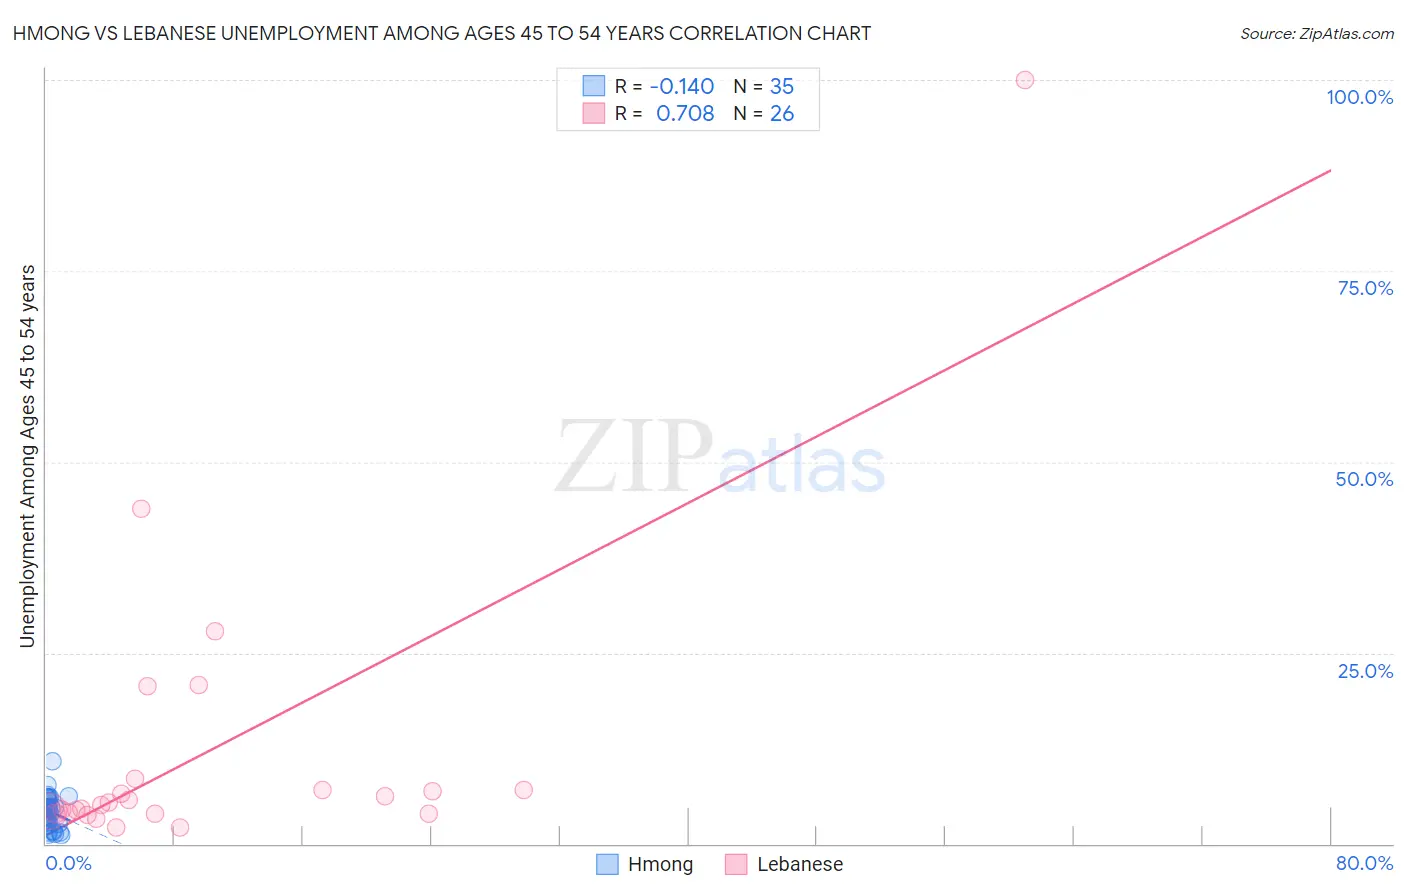
Hmong vs Lebanese Unemployment Among Ages 45 to 54 years Correlation Chart
The statistical analysis conducted on geographies consisting of 24,607,345 people shows a poor negative correlation between the proportion of Hmong and unemployment rate among population between the ages 45 and 54 in the United States with a correlation coefficient (R) of -0.140 and weighted average of 3.7%. Similarly, the statistical analysis conducted on geographies consisting of 390,458,993 people shows a strong positive correlation between the proportion of Lebanese and unemployment rate among population between the ages 45 and 54 in the United States with a correlation coefficient (R) of 0.708 and weighted average of 4.4%, a difference of 18.9%.
Unemployment Among Ages 45 to 54 years Correlation Summary
| Measurement | Hmong | Lebanese |
| Minimum | 1.2% | 2.2% |
| Maximum | 10.8% | 100.0% |
| Range | 9.6% | 97.8% |
| Mean | 4.2% | 12.2% |
| Median | 4.3% | 5.2% |
| Interquartile 25% (IQ1) | 2.7% | 4.0% |
| Interquartile 75% (IQ3) | 5.9% | 7.0% |
| Interquartile Range (IQR) | 3.2% | 3.0% |
| Standard Deviation (Sample) | 2.1% | 20.3% |
| Standard Deviation (Population) | 2.1% | 19.9% |
Similar Demographics by Unemployment Among Ages 45 to 54 years
Demographics Similar to Hmong by Unemployment Among Ages 45 to 54 years
In terms of unemployment among ages 45 to 54 years, the demographic groups most similar to Hmong are Fijian (3.8%, a difference of 0.78%), Norwegian (3.9%, a difference of 3.1%), Immigrants from India (3.9%, a difference of 4.0%), Danish (3.9%, a difference of 4.2%), and Immigrants from Cuba (3.9%, a difference of 4.4%).
| Demographics | Rating | Rank | Unemployment Among Ages 45 to 54 years |
| Hmong | 100.0 /100 | #1 | Exceptional 3.7% |
| Fijians | 100.0 /100 | #2 | Exceptional 3.8% |
| Norwegians | 100.0 /100 | #3 | Exceptional 3.9% |
| Immigrants | India | 100.0 /100 | #4 | Exceptional 3.9% |
| Danes | 100.0 /100 | #5 | Exceptional 3.9% |
| Immigrants | Cuba | 100.0 /100 | #6 | Exceptional 3.9% |
| Immigrants | Venezuela | 100.0 /100 | #7 | Exceptional 3.9% |
| Chinese | 100.0 /100 | #8 | Exceptional 4.0% |
| Czechs | 100.0 /100 | #9 | Exceptional 4.0% |
| Venezuelans | 100.0 /100 | #10 | Exceptional 4.0% |
| Scandinavians | 100.0 /100 | #11 | Exceptional 4.0% |
| Swedes | 100.0 /100 | #12 | Exceptional 4.0% |
| Cubans | 100.0 /100 | #13 | Exceptional 4.0% |
| Immigrants | Bosnia and Herzegovina | 100.0 /100 | #14 | Exceptional 4.0% |
| Immigrants | Bolivia | 100.0 /100 | #15 | Exceptional 4.0% |
Demographics Similar to Lebanese by Unemployment Among Ages 45 to 54 years
In terms of unemployment among ages 45 to 54 years, the demographic groups most similar to Lebanese are Immigrants from Congo (4.4%, a difference of 0.010%), Immigrants from Kuwait (4.4%, a difference of 0.020%), Immigrants from Zaire (4.4%, a difference of 0.10%), Immigrants from Middle Africa (4.4%, a difference of 0.12%), and Immigrants from Eastern Asia (4.4%, a difference of 0.17%).
| Demographics | Rating | Rank | Unemployment Among Ages 45 to 54 years |
| Celtics | 86.2 /100 | #130 | Excellent 4.4% |
| Immigrants | Germany | 85.9 /100 | #131 | Excellent 4.4% |
| Immigrants | Eastern Africa | 85.1 /100 | #132 | Excellent 4.4% |
| Immigrants | Cameroon | 84.8 /100 | #133 | Excellent 4.4% |
| Afghans | 84.6 /100 | #134 | Excellent 4.4% |
| Immigrants | Eastern Asia | 84.0 /100 | #135 | Excellent 4.4% |
| Immigrants | Middle Africa | 83.3 /100 | #136 | Excellent 4.4% |
| Lebanese | 81.9 /100 | #137 | Excellent 4.4% |
| Immigrants | Congo | 81.8 /100 | #138 | Excellent 4.4% |
| Immigrants | Kuwait | 81.7 /100 | #139 | Excellent 4.4% |
| Immigrants | Zaire | 80.7 /100 | #140 | Excellent 4.4% |
| Immigrants | Afghanistan | 79.6 /100 | #141 | Good 4.4% |
| Immigrants | Netherlands | 79.4 /100 | #142 | Good 4.4% |
| Macedonians | 79.0 /100 | #143 | Good 4.5% |
| Taiwanese | 77.9 /100 | #144 | Good 4.5% |