Honduran vs Tohono O'odham Unemployment Among Seniors over 65 years
COMPARE
Honduran
Tohono O'odham
Unemployment Among Seniors over 65 years
Unemployment Among Seniors over 65 years Comparison
Hondurans
Tohono O'odham
5.3%
UNEMPLOYMENT AMONG SENIORS OVER 65 YEARS
5.6/ 100
METRIC RATING
225th/ 347
METRIC RANK
6.1%
UNEMPLOYMENT AMONG SENIORS OVER 65 YEARS
0.0/ 100
METRIC RATING
334th/ 347
METRIC RANK
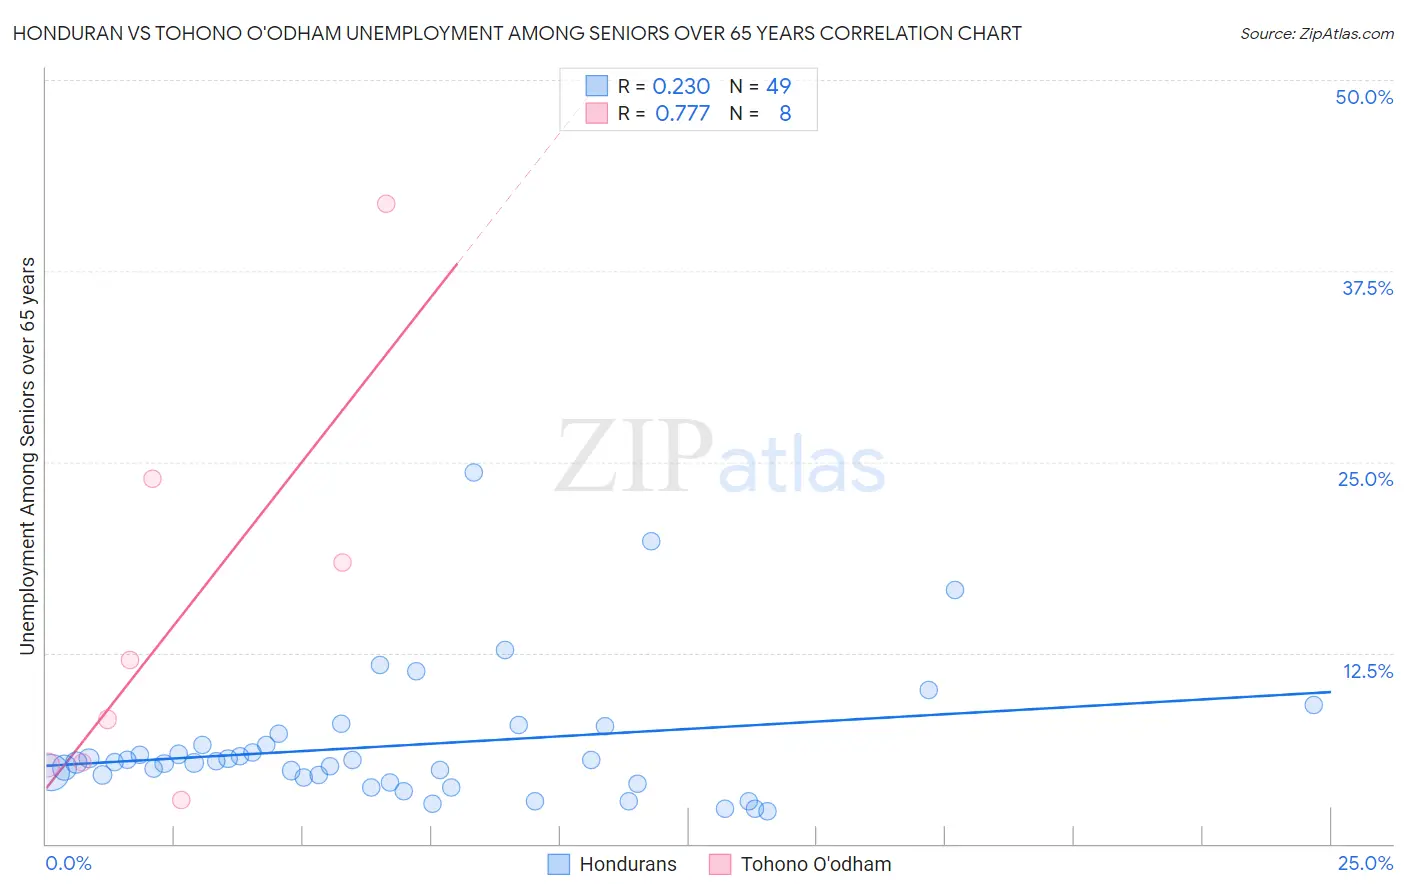
Honduran vs Tohono O'odham Unemployment Among Seniors over 65 years Correlation Chart
The statistical analysis conducted on geographies consisting of 325,799,576 people shows a weak positive correlation between the proportion of Hondurans and unemployment rate amomg seniors over the age of 65 in the United States with a correlation coefficient (R) of 0.230 and weighted average of 5.3%. Similarly, the statistical analysis conducted on geographies consisting of 57,554,750 people shows a strong positive correlation between the proportion of Tohono O'odham and unemployment rate amomg seniors over the age of 65 in the United States with a correlation coefficient (R) of 0.777 and weighted average of 6.1%, a difference of 16.6%.
Unemployment Among Seniors over 65 years Correlation Summary
| Measurement | Honduran | Tohono O'odham |
| Minimum | 2.1% | 2.8% |
| Maximum | 24.3% | 41.9% |
| Range | 22.2% | 39.1% |
| Mean | 6.4% | 14.7% |
| Median | 5.4% | 10.1% |
| Interquartile 25% (IQ1) | 4.2% | 5.2% |
| Interquartile 75% (IQ3) | 6.9% | 21.1% |
| Interquartile Range (IQR) | 2.7% | 15.9% |
| Standard Deviation (Sample) | 4.3% | 13.1% |
| Standard Deviation (Population) | 4.3% | 12.3% |
Similar Demographics by Unemployment Among Seniors over 65 years
Demographics Similar to Hondurans by Unemployment Among Seniors over 65 years
In terms of unemployment among seniors over 65 years, the demographic groups most similar to Hondurans are Immigrants from Syria (5.3%, a difference of 0.010%), Cree (5.3%, a difference of 0.030%), Immigrants from Croatia (5.3%, a difference of 0.050%), French American Indian (5.3%, a difference of 0.060%), and Israeli (5.3%, a difference of 0.090%).
| Demographics | Rating | Rank | Unemployment Among Seniors over 65 years |
| Spaniards | 7.4 /100 | #218 | Tragic 5.2% |
| Dutch West Indians | 6.9 /100 | #219 | Tragic 5.3% |
| Egyptians | 6.4 /100 | #220 | Tragic 5.3% |
| Arapaho | 6.3 /100 | #221 | Tragic 5.3% |
| Israelis | 6.2 /100 | #222 | Tragic 5.3% |
| Cree | 5.8 /100 | #223 | Tragic 5.3% |
| Immigrants | Syria | 5.6 /100 | #224 | Tragic 5.3% |
| Hondurans | 5.6 /100 | #225 | Tragic 5.3% |
| Immigrants | Croatia | 5.3 /100 | #226 | Tragic 5.3% |
| French American Indians | 5.2 /100 | #227 | Tragic 5.3% |
| Haitians | 4.4 /100 | #228 | Tragic 5.3% |
| Samoans | 4.2 /100 | #229 | Tragic 5.3% |
| Immigrants | Argentina | 4.0 /100 | #230 | Tragic 5.3% |
| Hungarians | 3.9 /100 | #231 | Tragic 5.3% |
| Hopi | 3.5 /100 | #232 | Tragic 5.3% |
Demographics Similar to Tohono O'odham by Unemployment Among Seniors over 65 years
In terms of unemployment among seniors over 65 years, the demographic groups most similar to Tohono O'odham are Immigrants from Armenia (6.2%, a difference of 0.28%), Pima (6.3%, a difference of 2.1%), Immigrants from Dominican Republic (6.0%, a difference of 2.2%), Alaska Native (6.3%, a difference of 2.6%), and Aleut (6.0%, a difference of 2.7%).
| Demographics | Rating | Rank | Unemployment Among Seniors over 65 years |
| Bermudans | 0.0 /100 | #327 | Tragic 5.9% |
| Puerto Ricans | 0.0 /100 | #328 | Tragic 5.9% |
| Dominicans | 0.0 /100 | #329 | Tragic 6.0% |
| Immigrants | Portugal | 0.0 /100 | #330 | Tragic 6.0% |
| Taiwanese | 0.0 /100 | #331 | Tragic 6.0% |
| Aleuts | 0.0 /100 | #332 | Tragic 6.0% |
| Immigrants | Dominican Republic | 0.0 /100 | #333 | Tragic 6.0% |
| Tohono O'odham | 0.0 /100 | #334 | Tragic 6.1% |
| Immigrants | Armenia | 0.0 /100 | #335 | Tragic 6.2% |
| Pima | 0.0 /100 | #336 | Tragic 6.3% |
| Alaska Natives | 0.0 /100 | #337 | Tragic 6.3% |
| Immigrants | Azores | 0.0 /100 | #338 | Tragic 6.3% |
| Paiute | 0.0 /100 | #339 | Tragic 6.3% |
| Ute | 0.0 /100 | #340 | Tragic 6.3% |
| Yakama | 0.0 /100 | #341 | Tragic 6.7% |