Immigrants from Africa vs Immigrants from Belarus Unemployment Among Ages 65 to 74 years
COMPARE
Immigrants from Africa
Immigrants from Belarus
Unemployment Among Ages 65 to 74 years
Unemployment Among Ages 65 to 74 years Comparison
Immigrants from Africa
Immigrants from Belarus
5.4%
UNEMPLOYMENT AMONG AGES 65 TO 74 YEARS
28.3/ 100
METRIC RATING
189th/ 347
METRIC RANK
5.3%
UNEMPLOYMENT AMONG AGES 65 TO 74 YEARS
90.1/ 100
METRIC RATING
118th/ 347
METRIC RANK
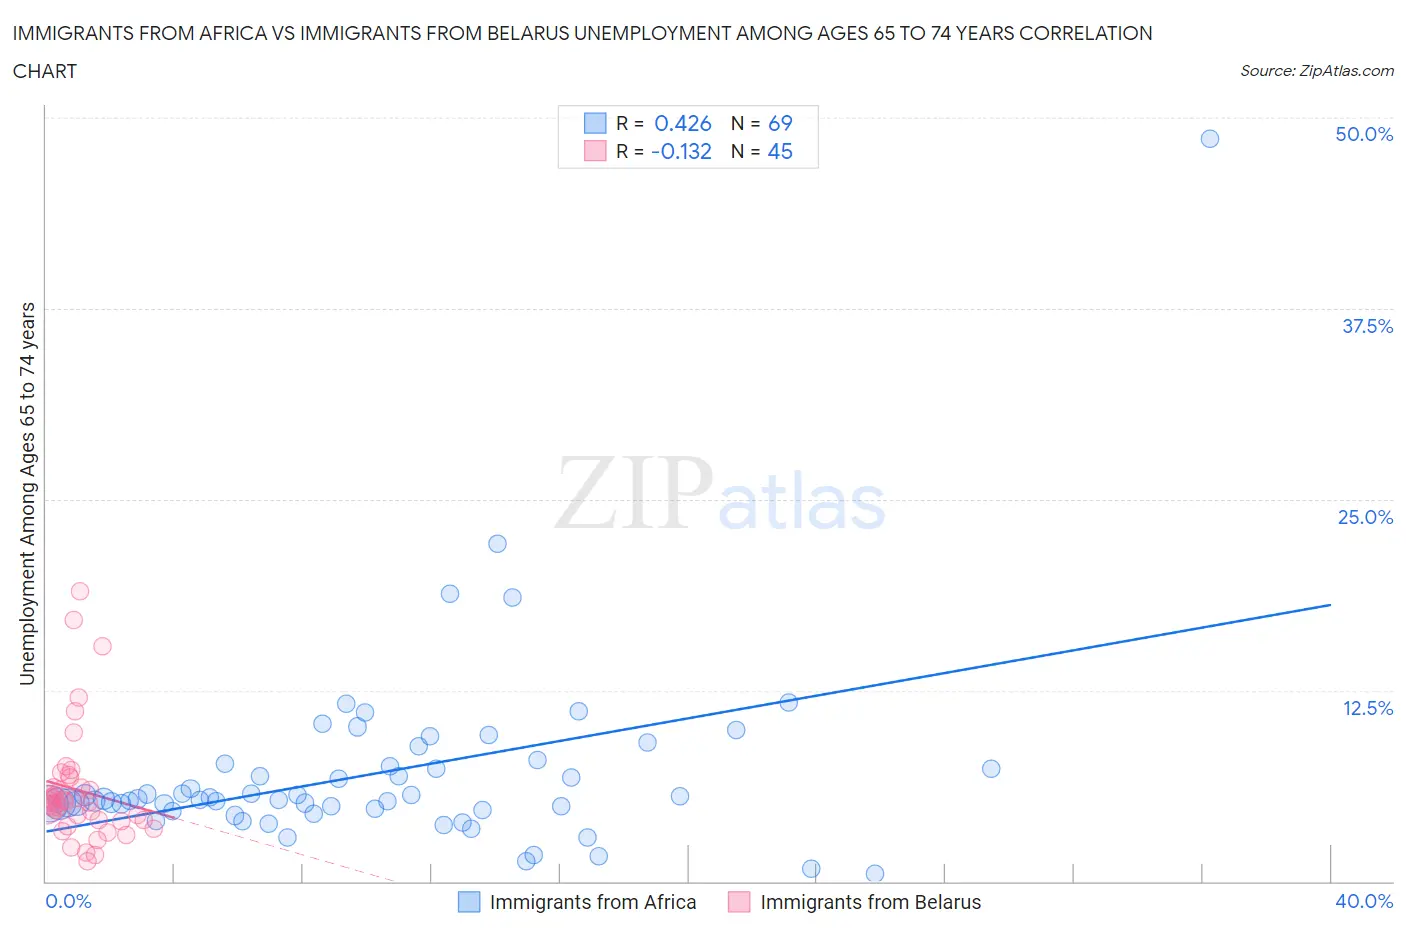
Immigrants from Africa vs Immigrants from Belarus Unemployment Among Ages 65 to 74 years Correlation Chart
The statistical analysis conducted on geographies consisting of 402,969,428 people shows a moderate positive correlation between the proportion of Immigrants from Africa and unemployment rate among population between the ages 65 and 74 in the United States with a correlation coefficient (R) of 0.426 and weighted average of 5.4%. Similarly, the statistical analysis conducted on geographies consisting of 143,080,232 people shows a poor negative correlation between the proportion of Immigrants from Belarus and unemployment rate among population between the ages 65 and 74 in the United States with a correlation coefficient (R) of -0.132 and weighted average of 5.3%, a difference of 2.7%.
Unemployment Among Ages 65 to 74 years Correlation Summary
| Measurement | Immigrants from Africa | Immigrants from Belarus |
| Minimum | 0.50% | 1.3% |
| Maximum | 48.6% | 19.0% |
| Range | 48.1% | 17.6% |
| Mean | 7.1% | 6.0% |
| Median | 5.4% | 5.1% |
| Interquartile 25% (IQ1) | 4.7% | 4.0% |
| Interquartile 75% (IQ3) | 7.6% | 6.4% |
| Interquartile Range (IQR) | 2.9% | 2.5% |
| Standard Deviation (Sample) | 6.3% | 3.7% |
| Standard Deviation (Population) | 6.3% | 3.7% |
Similar Demographics by Unemployment Among Ages 65 to 74 years
Demographics Similar to Immigrants from Africa by Unemployment Among Ages 65 to 74 years
In terms of unemployment among ages 65 to 74 years, the demographic groups most similar to Immigrants from Africa are Immigrants from Europe (5.4%, a difference of 0.020%), Basque (5.4%, a difference of 0.070%), Immigrants from Egypt (5.4%, a difference of 0.070%), Maltese (5.4%, a difference of 0.080%), and Nonimmigrants (5.4%, a difference of 0.090%).
| Demographics | Rating | Rank | Unemployment Among Ages 65 to 74 years |
| Spanish Americans | 38.2 /100 | #182 | Fair 5.4% |
| Immigrants | Spain | 37.3 /100 | #183 | Fair 5.4% |
| Immigrants | Senegal | 35.2 /100 | #184 | Fair 5.4% |
| Russians | 34.4 /100 | #185 | Fair 5.4% |
| Lithuanians | 32.4 /100 | #186 | Fair 5.4% |
| Immigrants | Nonimmigrants | 30.6 /100 | #187 | Fair 5.4% |
| Immigrants | Europe | 28.8 /100 | #188 | Fair 5.4% |
| Immigrants | Africa | 28.3 /100 | #189 | Fair 5.4% |
| Basques | 26.6 /100 | #190 | Fair 5.4% |
| Immigrants | Egypt | 26.5 /100 | #191 | Fair 5.4% |
| Maltese | 26.4 /100 | #192 | Fair 5.4% |
| Cherokee | 25.8 /100 | #193 | Fair 5.4% |
| Immigrants | Denmark | 24.7 /100 | #194 | Fair 5.4% |
| Immigrants | China | 24.2 /100 | #195 | Fair 5.4% |
| Costa Ricans | 21.1 /100 | #196 | Fair 5.4% |
Demographics Similar to Immigrants from Belarus by Unemployment Among Ages 65 to 74 years
In terms of unemployment among ages 65 to 74 years, the demographic groups most similar to Immigrants from Belarus are Immigrants from Korea (5.3%, a difference of 0.010%), Immigrants from Fiji (5.3%, a difference of 0.010%), Immigrants from Switzerland (5.3%, a difference of 0.020%), Australian (5.3%, a difference of 0.030%), and Immigrants from Turkey (5.3%, a difference of 0.070%).
| Demographics | Rating | Rank | Unemployment Among Ages 65 to 74 years |
| Sri Lankans | 92.7 /100 | #111 | Exceptional 5.3% |
| Immigrants | South Central Asia | 92.4 /100 | #112 | Exceptional 5.3% |
| Immigrants | Germany | 91.6 /100 | #113 | Exceptional 5.3% |
| Asians | 91.1 /100 | #114 | Exceptional 5.3% |
| Immigrants | Turkey | 90.8 /100 | #115 | Exceptional 5.3% |
| Australians | 90.4 /100 | #116 | Exceptional 5.3% |
| Immigrants | Korea | 90.2 /100 | #117 | Exceptional 5.3% |
| Immigrants | Belarus | 90.1 /100 | #118 | Exceptional 5.3% |
| Immigrants | Fiji | 89.9 /100 | #119 | Excellent 5.3% |
| Immigrants | Switzerland | 89.9 /100 | #120 | Excellent 5.3% |
| Immigrants | Australia | 89.1 /100 | #121 | Excellent 5.3% |
| Immigrants | Canada | 89.0 /100 | #122 | Excellent 5.3% |
| Czechoslovakians | 88.6 /100 | #123 | Excellent 5.3% |
| Immigrants | Ukraine | 87.5 /100 | #124 | Excellent 5.3% |
| Pakistanis | 87.5 /100 | #125 | Excellent 5.3% |