Immigrants from Bangladesh vs Immigrants from Somalia Unemployment Among Women with Children Under 6 years
COMPARE
Immigrants from Bangladesh
Immigrants from Somalia
Unemployment Among Women with Children Under 6 years
Unemployment Among Women with Children Under 6 years Comparison
Immigrants from Bangladesh
Immigrants from Somalia
8.8%
UNEMPLOYMENT AMONG WOMEN WITH CHILDREN UNDER 6 YEARS
0.0/ 100
METRIC RATING
293rd/ 347
METRIC RANK
7.1%
UNEMPLOYMENT AMONG WOMEN WITH CHILDREN UNDER 6 YEARS
98.9/ 100
METRIC RATING
78th/ 347
METRIC RANK
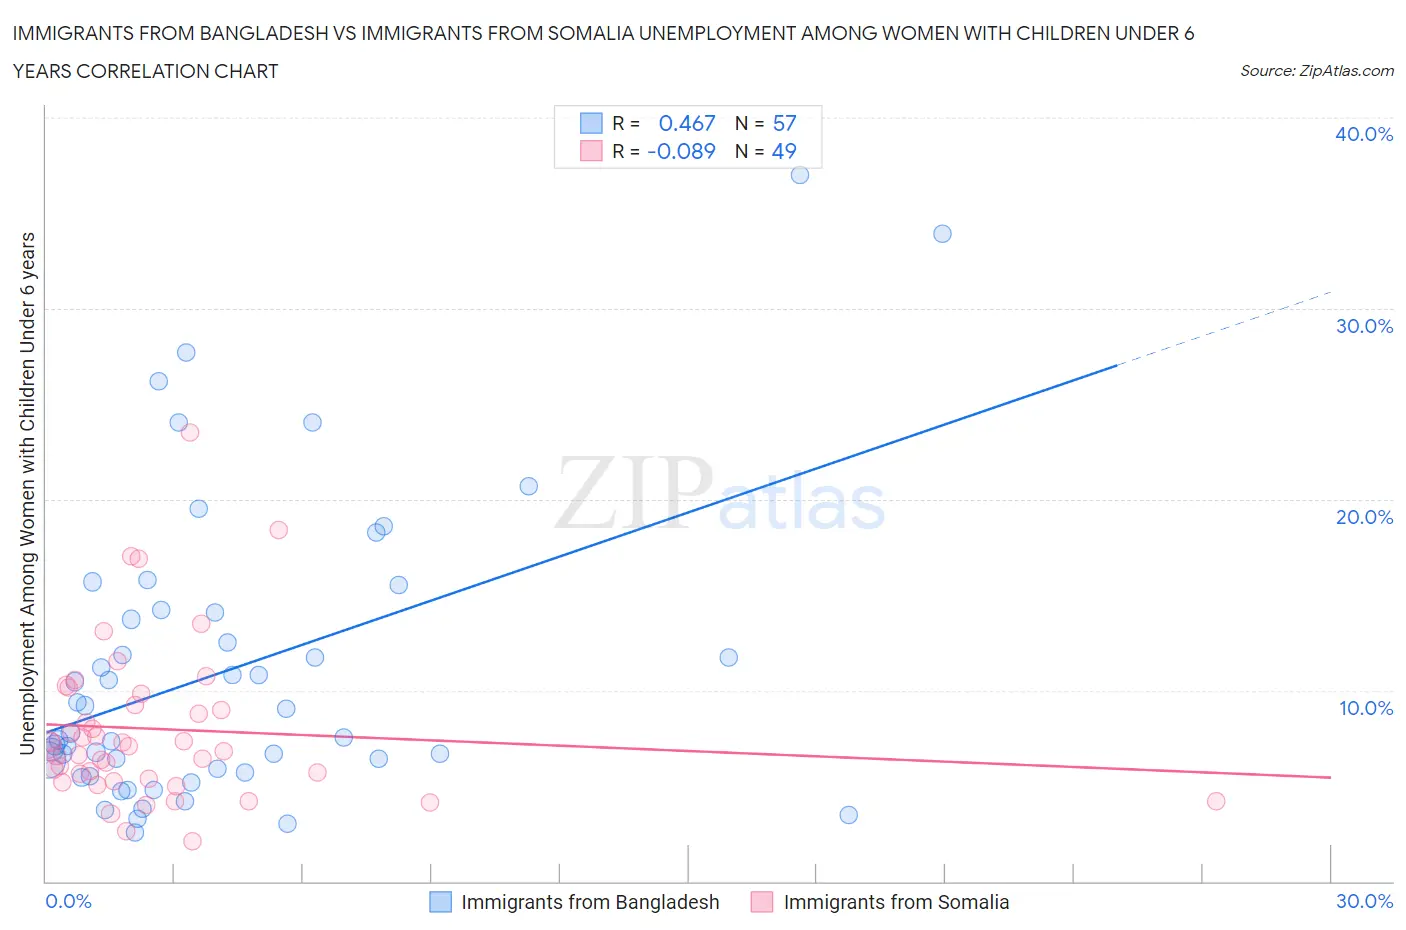
Immigrants from Bangladesh vs Immigrants from Somalia Unemployment Among Women with Children Under 6 years Correlation Chart
The statistical analysis conducted on geographies consisting of 173,597,971 people shows a moderate positive correlation between the proportion of Immigrants from Bangladesh and unemployment rate among women with children under the age of 6 in the United States with a correlation coefficient (R) of 0.467 and weighted average of 8.8%. Similarly, the statistical analysis conducted on geographies consisting of 84,437,163 people shows a slight negative correlation between the proportion of Immigrants from Somalia and unemployment rate among women with children under the age of 6 in the United States with a correlation coefficient (R) of -0.089 and weighted average of 7.1%, a difference of 24.9%.
Unemployment Among Women with Children Under 6 years Correlation Summary
| Measurement | Immigrants from Bangladesh | Immigrants from Somalia |
| Minimum | 2.5% | 2.1% |
| Maximum | 37.0% | 23.5% |
| Range | 34.5% | 21.4% |
| Mean | 11.1% | 8.0% |
| Median | 7.8% | 7.1% |
| Interquartile 25% (IQ1) | 5.8% | 5.3% |
| Interquartile 75% (IQ3) | 14.2% | 9.5% |
| Interquartile Range (IQR) | 8.4% | 4.2% |
| Standard Deviation (Sample) | 7.7% | 4.2% |
| Standard Deviation (Population) | 7.6% | 4.2% |
Similar Demographics by Unemployment Among Women with Children Under 6 years
Demographics Similar to Immigrants from Bangladesh by Unemployment Among Women with Children Under 6 years
In terms of unemployment among women with children under 6 years, the demographic groups most similar to Immigrants from Bangladesh are Nonimmigrants (8.8%, a difference of 0.19%), Cheyenne (8.8%, a difference of 0.23%), Immigrants from Central America (8.9%, a difference of 0.23%), Immigrants from Dominican Republic (8.9%, a difference of 0.36%), and Mexican (8.9%, a difference of 0.46%).
| Demographics | Rating | Rank | Unemployment Among Women with Children Under 6 years |
| Seminole | 0.0 /100 | #286 | Tragic 8.7% |
| Menominee | 0.0 /100 | #287 | Tragic 8.7% |
| Bahamians | 0.0 /100 | #288 | Tragic 8.7% |
| Iroquois | 0.0 /100 | #289 | Tragic 8.7% |
| Vietnamese | 0.0 /100 | #290 | Tragic 8.8% |
| Jamaicans | 0.0 /100 | #291 | Tragic 8.8% |
| Cheyenne | 0.0 /100 | #292 | Tragic 8.8% |
| Immigrants | Bangladesh | 0.0 /100 | #293 | Tragic 8.8% |
| Immigrants | Nonimmigrants | 0.0 /100 | #294 | Tragic 8.8% |
| Immigrants | Central America | 0.0 /100 | #295 | Tragic 8.9% |
| Immigrants | Dominican Republic | 0.0 /100 | #296 | Tragic 8.9% |
| Mexicans | 0.0 /100 | #297 | Tragic 8.9% |
| Tlingit-Haida | 0.0 /100 | #298 | Tragic 8.9% |
| Immigrants | Jamaica | 0.0 /100 | #299 | Tragic 8.9% |
| Creek | 0.0 /100 | #300 | Tragic 8.9% |
Demographics Similar to Immigrants from Somalia by Unemployment Among Women with Children Under 6 years
In terms of unemployment among women with children under 6 years, the demographic groups most similar to Immigrants from Somalia are Immigrants from Croatia (7.1%, a difference of 0.040%), Immigrants from Fiji (7.1%, a difference of 0.050%), Estonian (7.1%, a difference of 0.070%), Immigrants from Greece (7.1%, a difference of 0.070%), and Immigrants from Venezuela (7.1%, a difference of 0.11%).
| Demographics | Rating | Rank | Unemployment Among Women with Children Under 6 years |
| Afghans | 99.4 /100 | #71 | Exceptional 7.0% |
| Cubans | 99.4 /100 | #72 | Exceptional 7.0% |
| Immigrants | Czechoslovakia | 99.2 /100 | #73 | Exceptional 7.0% |
| Turks | 99.2 /100 | #74 | Exceptional 7.0% |
| Immigrants | Eastern Europe | 99.0 /100 | #75 | Exceptional 7.1% |
| Estonians | 99.0 /100 | #76 | Exceptional 7.1% |
| Immigrants | Croatia | 98.9 /100 | #77 | Exceptional 7.1% |
| Immigrants | Somalia | 98.9 /100 | #78 | Exceptional 7.1% |
| Immigrants | Fiji | 98.9 /100 | #79 | Exceptional 7.1% |
| Immigrants | Greece | 98.9 /100 | #80 | Exceptional 7.1% |
| Immigrants | Venezuela | 98.8 /100 | #81 | Exceptional 7.1% |
| Immigrants | Afghanistan | 98.7 /100 | #82 | Exceptional 7.1% |
| Egyptians | 98.7 /100 | #83 | Exceptional 7.1% |
| Immigrants | Albania | 98.7 /100 | #84 | Exceptional 7.1% |
| Immigrants | Romania | 98.7 /100 | #85 | Exceptional 7.1% |